|
|
Grouping Results |
The Group By function enables you to create sub-groups of results by column headers. It is available in the Data Quality Analysis Report Detail Viewer grids. For example, in the Report Detail view of a Benchmark analysis, you can group results by LOB, then by Country, then by Coverage Type.
To group results:
1. From the Results pane, select Data Quality Analyses.
2. Select an analysis by clicking the leftmost cell in its row.
3. Click the plus symbol (+) to display the specific analyses types (diagnostics) used in the analysis.
4. Select the analysis you would like to view in detail, such as "Review Industry Data".
The Report Detail viewer opens and displays the Review Industry Data analysis.
5. Select the view, such as "Results by Coverage".
6. Select the way you want results grouped for your initial view, such as "by Country".
7. On the toolbar, click the Group By icon.
The grouping area opens at the top of the grid.
8. Drag the column header you would like to group by into
the grouping area.  Example
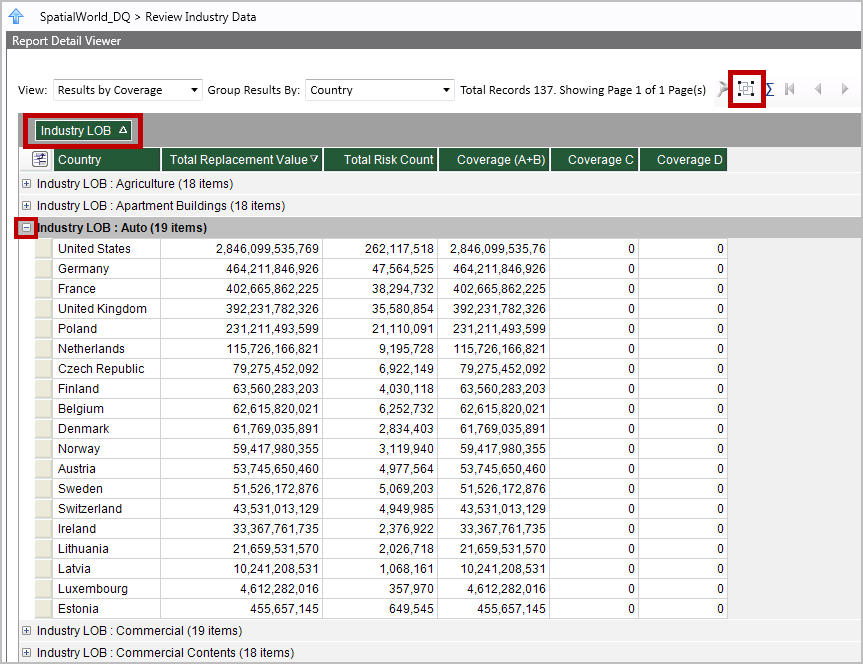
9. To add another grouping, drag another column header to the grouping area, to the right of the first grouping.
Touchstone groups and sub-groups the results according to your selections.
10. Click the plus symbol (+) to view contents of your groups.
11. To clear a grouping, drag the column header from the grouping area back to its original place in the grid.
|
© 2020 AIR Worldwide. All rights reserved. Touchstone 7.0 Updated September 03, 2020 |
