|
|
Filtering Widgets by Shape |
To filter widgets by shape:
1. On the map, Zoom
in close on the area where you want to draw a shape. For example,
zoom in on the  San
Francisco area.
San
Francisco area.
2. On the Mapping ribbon, clear the Clustered Points layer (in the Project Layers area). Since clusters provide a generalized, low-resolution view of the underlying exposures, and polygons and ellipses are more precise, you will be able to draw a more accurate shape without the Clustered Points layer.
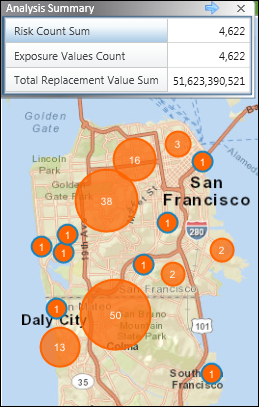
3. On the Spatial ribbon, select Filter Widgets by Shapes. When you first select this option, the Analysis Summary widget displays this message: "The filters applied to this widget resulted in no data." The widget will be filled with data after you draw a shape on the map. Move the Analysis Summary widget away from the targeted area.
4. On the Mapping ribbon, in
the Drawing and Selection Tools area, click
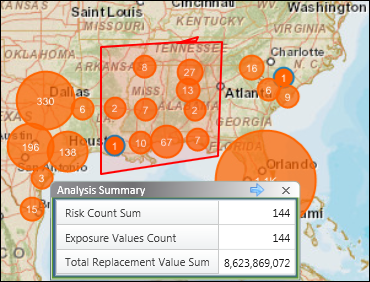
the shape you want to use. For example, draw a polygon that captures locations
in an area
bounded by the Golden Gate, Daly City, Oakland, and Emeryville.
Click these links for information about how to draw each shape: Polygon
or Ellipse.
The Analysis Summary widget reflects the values for the exposures that
fall within the shape.
5. To return to regular selection mode, click the Pointer icon on the Mapping ribbon.
6. To clear all the shapes, click Clear Shapes on the Mapping ribbon.
|
© 2020 AIR Worldwide. All rights reserved. Touchstone 7.0 Updated September 03, 2020 |