|
|
Spatial Analysis Options |
The Spatial ribbon on the Results tab enables you to perform various functions, including the use of widgets to filter all the results that are visible on the screen into a chart or table. The items that are active on the Spatial ribbon depend on the content element that is currently highlighted.
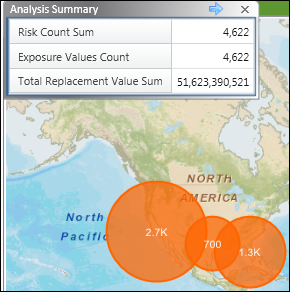
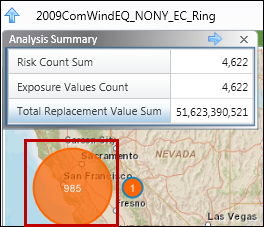
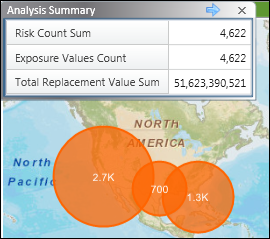
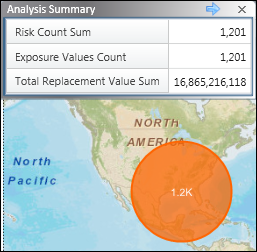
When you initially open the results, the map displays clustered points
and the Analysis Summary widget (in tabular format) displays the risk
count sum, exposure values count, and total replacement value or total
employees sum for the visible locations. When you click a point on the
map, a pop-up window displays location information and, depending on the
analysis type, TRV data or employee data. Click  here
for screens that illustrate how the values change in the Analysis Summary
widget as you zoom in and filter the widgets by the map extent.
here
for screens that illustrate how the values change in the Analysis Summary
widget as you zoom in and filter the widgets by the map extent.
• Result Display Mode: Accumulation Display enables you to view accumulated losses deterministically, for example, by rings and damage ranges—you cannot interact with the results. Interactive Browser, which is available only when Enable Dynamic Results was selected during the Geospatial Analysis configuration, enables you to filter results, work with map layers, and use widgets.
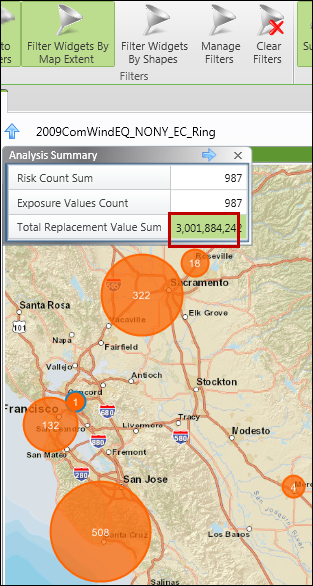
• Filters
• Auto Filters: Enables you to enable or disable global filtering. AIR recommends that you leave this option enabled (this is the default).
• Filter Widgets By Map Extent: Enables you to filter values based on what is visible on the map, the "map extent". For example, you analyze your exposures in Oklahoma using the Moore OK shapefile. In the initial unfiltered view of the results, the total replacement value is $29,697,746,983. However, you want to see the analysis summary only for a specific area around Moore. You zoom in until you see that area. As you zoom in, the analysis summary values reflect values only for the exposures that are visible on the map. If you run a Workers' Compensation analysis, you can filter employee information based on what is visible on the map.
• Filter Widgets By Shapes: Enables you to view accumulations of values by drawing one or more shapes on the map. For example, you may want to see the analysis data for a particular area near San Francisco. Click here for information about filtering widgets by shapes.
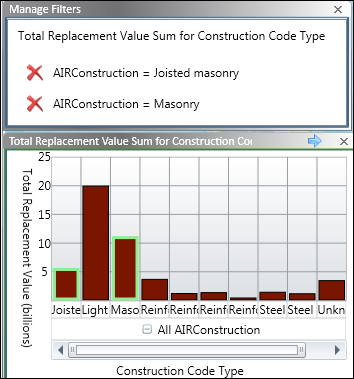
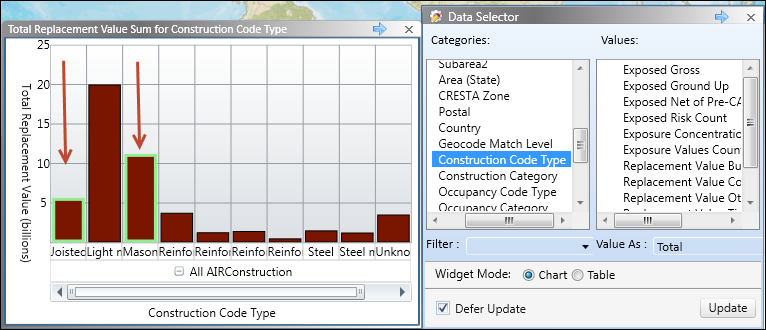
• Manage Filters: Opens a window that displays the
contents of the master filter, which contains all the filters defined
by the interactive chart/table widgets whose results are reflected in
the Analysis Summary widget and the map. For example, you create a basic
chart widget that shows total replacement value (TRV) by construction
codes. You filter the widget by clicking the Joisted
masonry and Masonry bars in the chart. As you click each bar, the TRV
in the Analysis Summary widget changes and the number of locations change
on the map. Click Manage Filters
to open the Manage
Filters window and see the newly created filter.
• Clear Filters: Removes filters from each subscribed widget. The Manage Filters window is now empty.
• Widget Display
• Subtotals: Toggles subtotals off or on for all columns. For example, you create a widget that includes the Risk Count Sum and Exposure Values Count. When Subtotals is enabled, each row includes a subtotal in the All AccumulatorName field.
• Subscribe
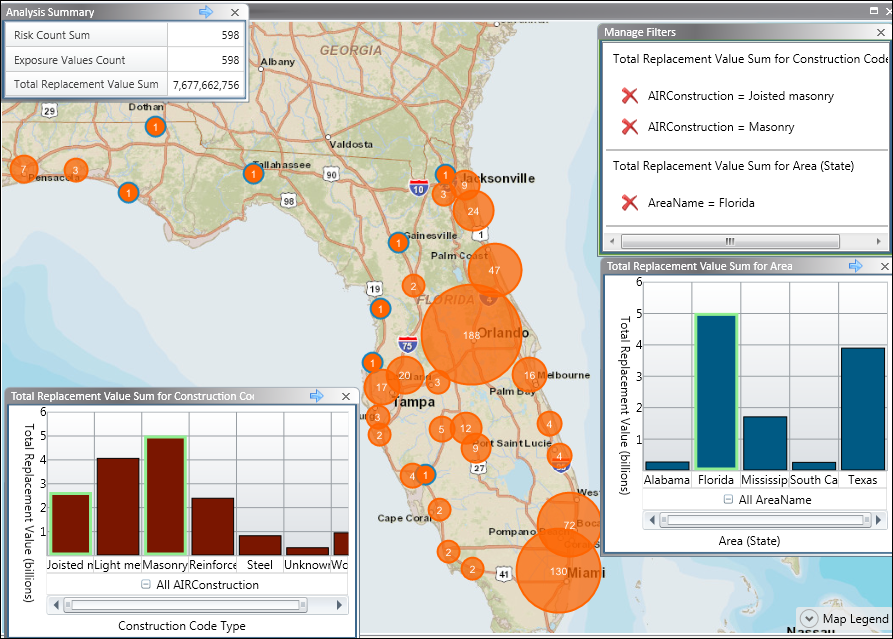
to Master Filter: The master filter
is a collection of all the filters that the user has created and that
are subscribed to the master filter. By default, all widgets are subscribed
to the master filter. (Filtering widgets by map extent or by shapes does
not create filters that can be subscribed to the master filter.) Changes
to the master filter result in changes to all subscribed widgets. For
example, you create a filter for TRV by Joisted masonry and Masonry construction.
You then create a widget for TRV by Area (State) and click the Florida
bar to show only Florida exposures. The master filter, which can be viewed
in the Manage Filters window, now includes two filters. The Analysis Summary
widget and the map reflect the application of both filters to the exposure
data. Click here
to see all the widgets used to produce the filtered results.
• Tools: Enables you to copy, paste, rename, delete, save, and load widgets. You can also export widget data.
|
© 2020 AIR Worldwide. All rights reserved. Touchstone 7.0 Updated September 03, 2020 |