|
|
Map Tools 5.1 and Later |
In Touchstone 5.1 and later, the map tools appear in the upper right corner of the map.
While the map tools are available with all maps, the icons that appear vary according to the function for which you are viewing the map and, in some cases, according to the mode (Portfolio mode or Underwriting Contract mode).
To work with a map tool, click the tool icon. When you are finished working with it, click it again.
Click ![]() to reset the toolbar to the default state.
to reset the toolbar to the default state.
The Base Maps tool enables you to select the base map: Streets, Satellite, Topographic, or Grayscale. For example, you can select Streets and then zoom in on a location until the street grid appears. The Grayscale option may make the map easier to read because of the increased contrast between layers.
The Project Layers tool enables you to view the map in several additional ways, at the same time. Click the three dots below an icon for more options, such as "Zoom to layer".
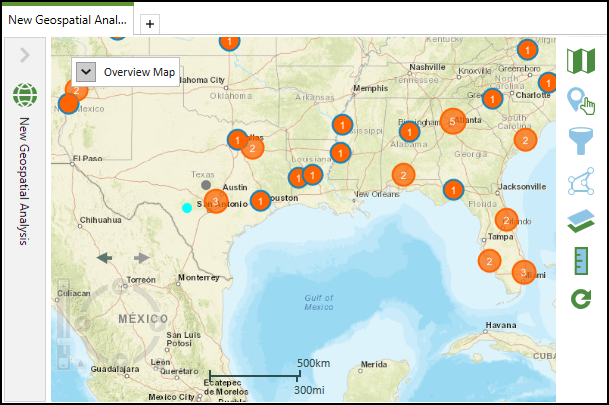
• Clustered Points: This is the default option. It displays individual locations and clusters of locations on the map. Clusters provide a generalized, low-resolution view of the underlying exposures. Analysis results are always based on the actual locations underlying the clusters.
• Heat Map: Click this option to overlay colors on the exposure data. The colors indicate the level of concentration, from least to most concentration. The Legend tab in the Map Layers tool includes a Heat Map section where you can edit the border colors and intensity by clicking a color and then edit the settings in the Symbology Editor.
• Thematic Summary: This option, which is available only when exposure maps are available, enables you to display exposure location values—number of locations and total replacement value—aggregated by administrative boundaries at multiple, different resolutions, and based on a hierarchy of area levels. You can configure several settings by clicking the three dots below the icon, selecting Manage Thematic Summary, and modifying settings in the editor: Summary Options, Palette, and Persistence.
The Map Filters tool enables you to filter locations on a map. It is available only in Portfolio mode and only when there is an Exposure Summary for the exposure view. You can see the Map Filters tool in the Exposure Summary Dashboard. (Analyses still run on the entire exposure set, regardless of the filtered view on the map.).
You can select any combination of location perils and geocode match
levels to filter the locations on the map.  Example
The filter criteria affect the thematic map, the heat map, and any associated legends. To clear the filters, click Reset.
The Drawing Tools enable you to draw various shapes, save them, and use them on Touchstone maps.
The Map Layers tool enables you to: search for, filter, and add map layers; select active layers; and define a legend, including a thematic summary and heat map legend.
To search for and add layers:
1. Click Map Layers.
2. Select the Search tab.
3. In
the Search box, enter one or more characters.
Example
4. Select the check box for each layer that you want to add.
5. Click Add.
To filter layers:
1. Click the Filter icon.
2. Select the data types, perils, and regions, or "unknown".
3. Click
Apply. Example
To select active layers:
1. Click Map Layers.
2. Select the Active Layers tab.
3. Select the check box next to each layer that you want to apply to the map.
As you select the layer, it appears on the map.
4. Clear the check box next to each layer that you do not want to be active.
To remove a layer:
1. Highlight the layer.
2. Click the X (Remove active layer) next to it.
To change the opacity of a layer:
1. Highlight the layer.
2. Enter a percentage or click the down arrow next to the field and move the slider.
As you move the slider to the left, the cluster becomes more translucent, enabling you to see details behind the clusters.
To zoom in on a layer:
1. Highlight it.
2. Click ... (More options) and then click Zoom to layer.
If the layer was not already selected, it is automatically selected.
To reorder the layers in the list:
1. Move the pointer to the left of the layer until it
becomes a Move pointer ![]() and the "Reorder"
prompt appears.
and the "Reorder"
prompt appears.
2. Drag the layer to the target location in the list.
The Legend tab displays the legend for all the active layers.
1. To change the properties of a legend item, click the item.
The Symbology Editor dialog box opens where you
can edit various items, depending on the item that you select. Example
2. When you have edited the items, click OK.
When you change the fill color, you can select a new color from the current palette, from a derived palette, or from a recent palette. Or, you can click Advanced to manually edit colors.
The Measure Tools enable you to measure distances and areas. You measure distances by drawing a line or a polyline. You measure areas by drawing an ellipse (circle) or polygon. You can activate only one measuring tool at a time. The outline and fill color are not configurable. If you want to configure those properties, use the drawing tools.
To measure area for a circle or ellipse:
1. Click Ellipse and then click on the map to choose the centroid of the shape.
2. Move the pointer to draw the shape.
The total area and perimeter appear in the Measurement area as you draw the shape. You can change the measurement unit for the area (square feet, meters, kilometers, or miles) and the perimeter (feet, meters, kilometers, or miles).
To measure area for a polygon:
1. Click Polygon and then add the first vertex point by clicking once on the map.
2. Move the pointer and click on the map to add the next point.
3. After adding all the points, double-click to add the last point.
The total area and perimeter appear in the Measurement area as soon as you have added at least three points. You can change the measurement unit for the area (square feet, meters, kilometers, or miles) and the perimeter (feet, meters, kilometers, or miles).
To measure distance for a polyline:
1. Click Polyline and then add the first vertex point by clicking once on the map.
2. Move the pointer and click on the map to add the next point.
3. After adding all the points, double-click to add the last point.
The total length appears in the Measurement area as you create each segment. You can change the measurement unit (feet, meters, kilometers, or miles).
4. To create a single line, select Polyline, click on the map, click another point on the map, and then double-click.
|
© 2020 AIR Worldwide. All rights reserved. Touchstone 7.0 Updated September 03, 2020 |
