Aridity and vapor pressure deficit (VPD)
A number of studies (Abatzoglou and Kolden, 2013; Barbero et al., 2014; Seager et al., 2015; Williams et al., 2019) have looked at quantifying annual burned area using various aridity metrics. A clear consensus in the literature is that vapor pressure deficit is highly correlated with burned area in forested regions and only slightly less correlated with burned area in non-forested regions (see for example Seager et al., 2015) across the Western U.S. Furthermore, Abatzoglou and Kolden (2013) found strong correlations between fire and climate earlier in the same year for forested and non-forested areas, whereas climate from the preceding year was important for explaining burned area in non-forested areas.
Vapor pressure deficit (VPD) is defined as the amount of moisture missing from the atmosphere that would lead to saturation. It is expressed in units of pressure, because it represents the pressure that water vapor (a gas) exerts. Mathematically, VPD is the difference between the saturation vapor pressure (the amount of water vapor that would exist at saturation or 100% relative humidity) and the actual vapor pressure of the air:
VPD = es - ea
The saturation vapor pressure es is a function only of air temperature. As air temperature increases, the amount of water vapor that can be in the atmosphere at saturation increases exponentially. Vapor pressure deficit increases if the air temperature increases and/or if the water vapor in the atmosphere decreases (e.g., through prolonged reduction in precipitation and/or less evaporation from the surface).
Relative humidity, RH, is the ratio of actual vapor pressure ea to saturation vapor pressure es:
RH = 100% · ea/es
If the atmosphere is at 100% relative humidity, then the VPD is 0.
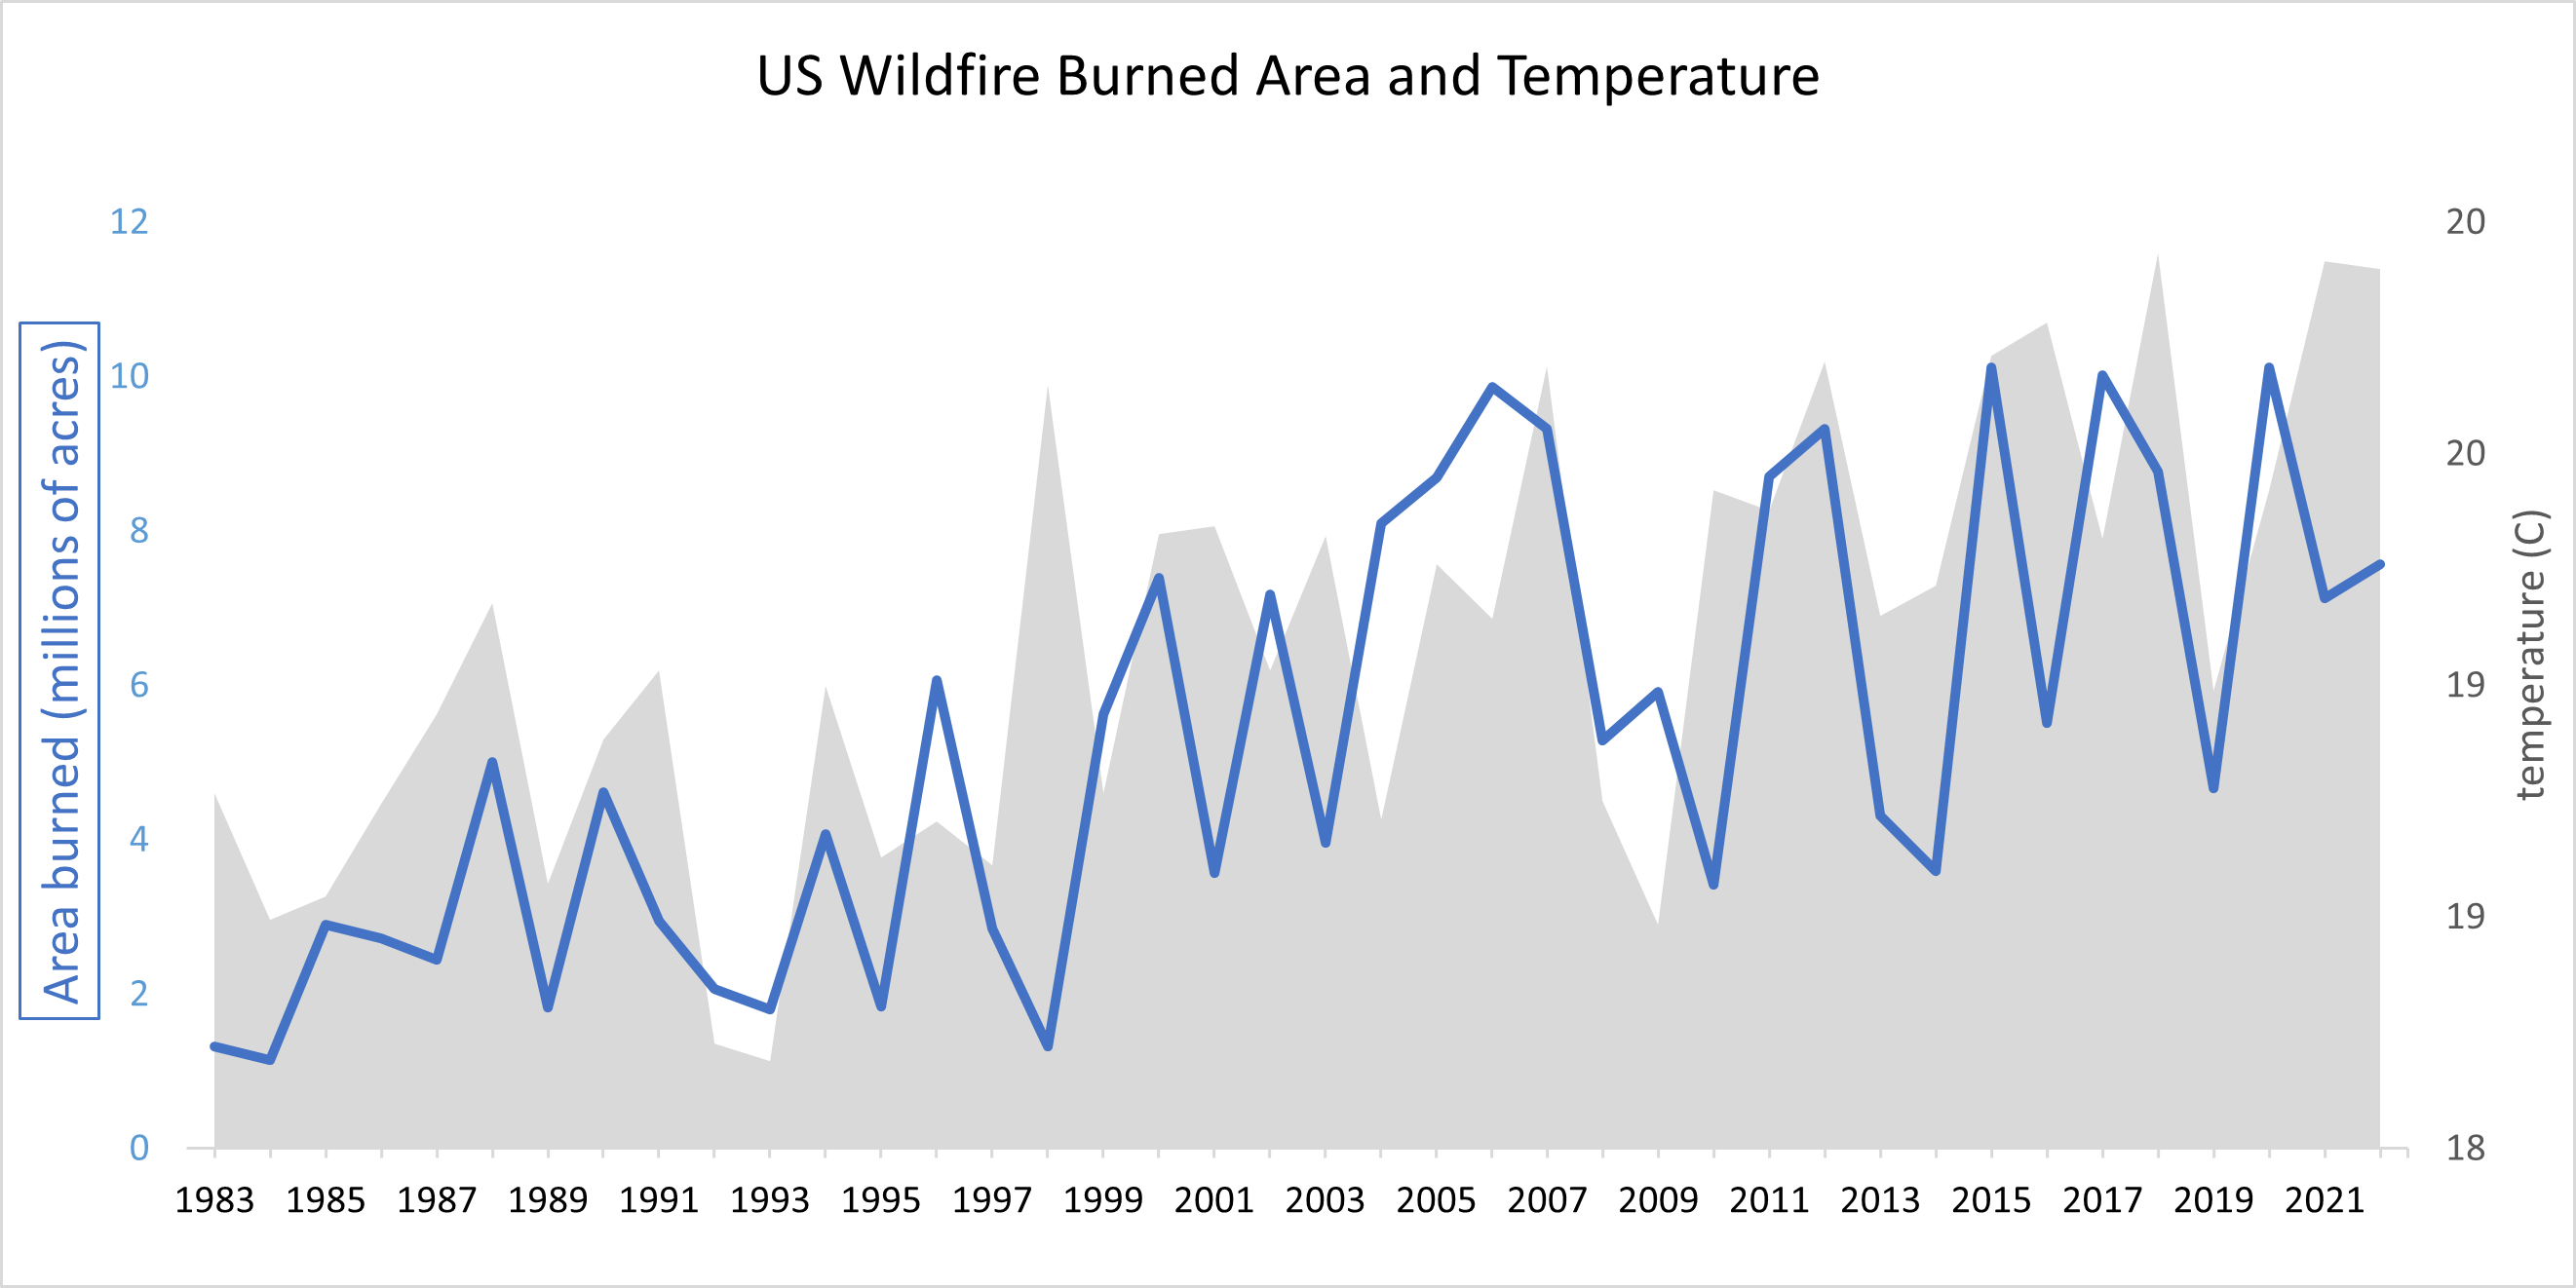
Data from National Inter-agency Fire Center and NOAA National Centers for Environmental information

Projections of future wildfire risk for the U.S. have been conducted by many of the same authors who have looked at historical trends. One limitation is that results are typically cast in terms of how the climate that is conducive for wildfires will change rather than actually how the wildfire activity itself will change. A brief summary of some key results is provided here.
Liu et al. (2010) used an early generation of climate models (CMIP3 – Climate Model Intercomparison Project Phase 3) to show that wildfire risk would increase in the U.S. and be particularly severe in the Western U.S. A lengthening of the wildfire season primarily because of warmer but also drier conditions would exacerbate the effect. Barbero et al. (2015) used the relationships they derived in a companion paper (Barbero et al. 2014) applied to output from 17 general circulation models (GCMs) to evaluate how climate change would impact wildfire risk in the U.S. by mid-21st century.1 A key finding from that study was the significant increases in the number of wildfire days on the order of hundreds of percent - especially over the inter-mountain West.
Abatzoglou and Williams (2016) performed counter factual modeling studies with GCMs for the recent historical past in parallel with studies that allowed greenhouse gases to increase as observed. Using historical relationships that they developed between observed climate and fire, they deduced that human-caused climate change has caused over half of the documented increases in fuel aridity since the 1970s and doubled the cumulative forest fire area since 1984. They concluded that anthropogenic climate change will continue to chronically enhance the potential for Western U.S. forest fire activity as long as fires are not fuel-limited.
Ficklin and Novick (2017) evaluated VPD output from a suite of later generation CMIP5 GCMs for late 21st century changes and found increases across all of the U.S. that were driven primarily from increases in saturation vapor pressure rather than decreases in actual vapor pressure. Moreover, the biggest changes they found were for the Midwest – just west of the Mississippi River (see their Figure 5).
Littell et al. (2018) defined regions in which there is relatively abundant vegetation that is, however, resilient to fires as "flammability-limited", and regions that have sparser but drier vegetation as "fuel-limited". They found that climate change is likely to contribute to much larger burned areas in flammability-limited regions, but contribute to smaller burned areas in fuel-limited regions.
