Results
This section begins with views of the current climate in terms of VPD, precipitation, wildfire hazard and insured loss as captured by the Verisk Wildfire Model for the United States. Future projections of these variables follow.
Near-present risk
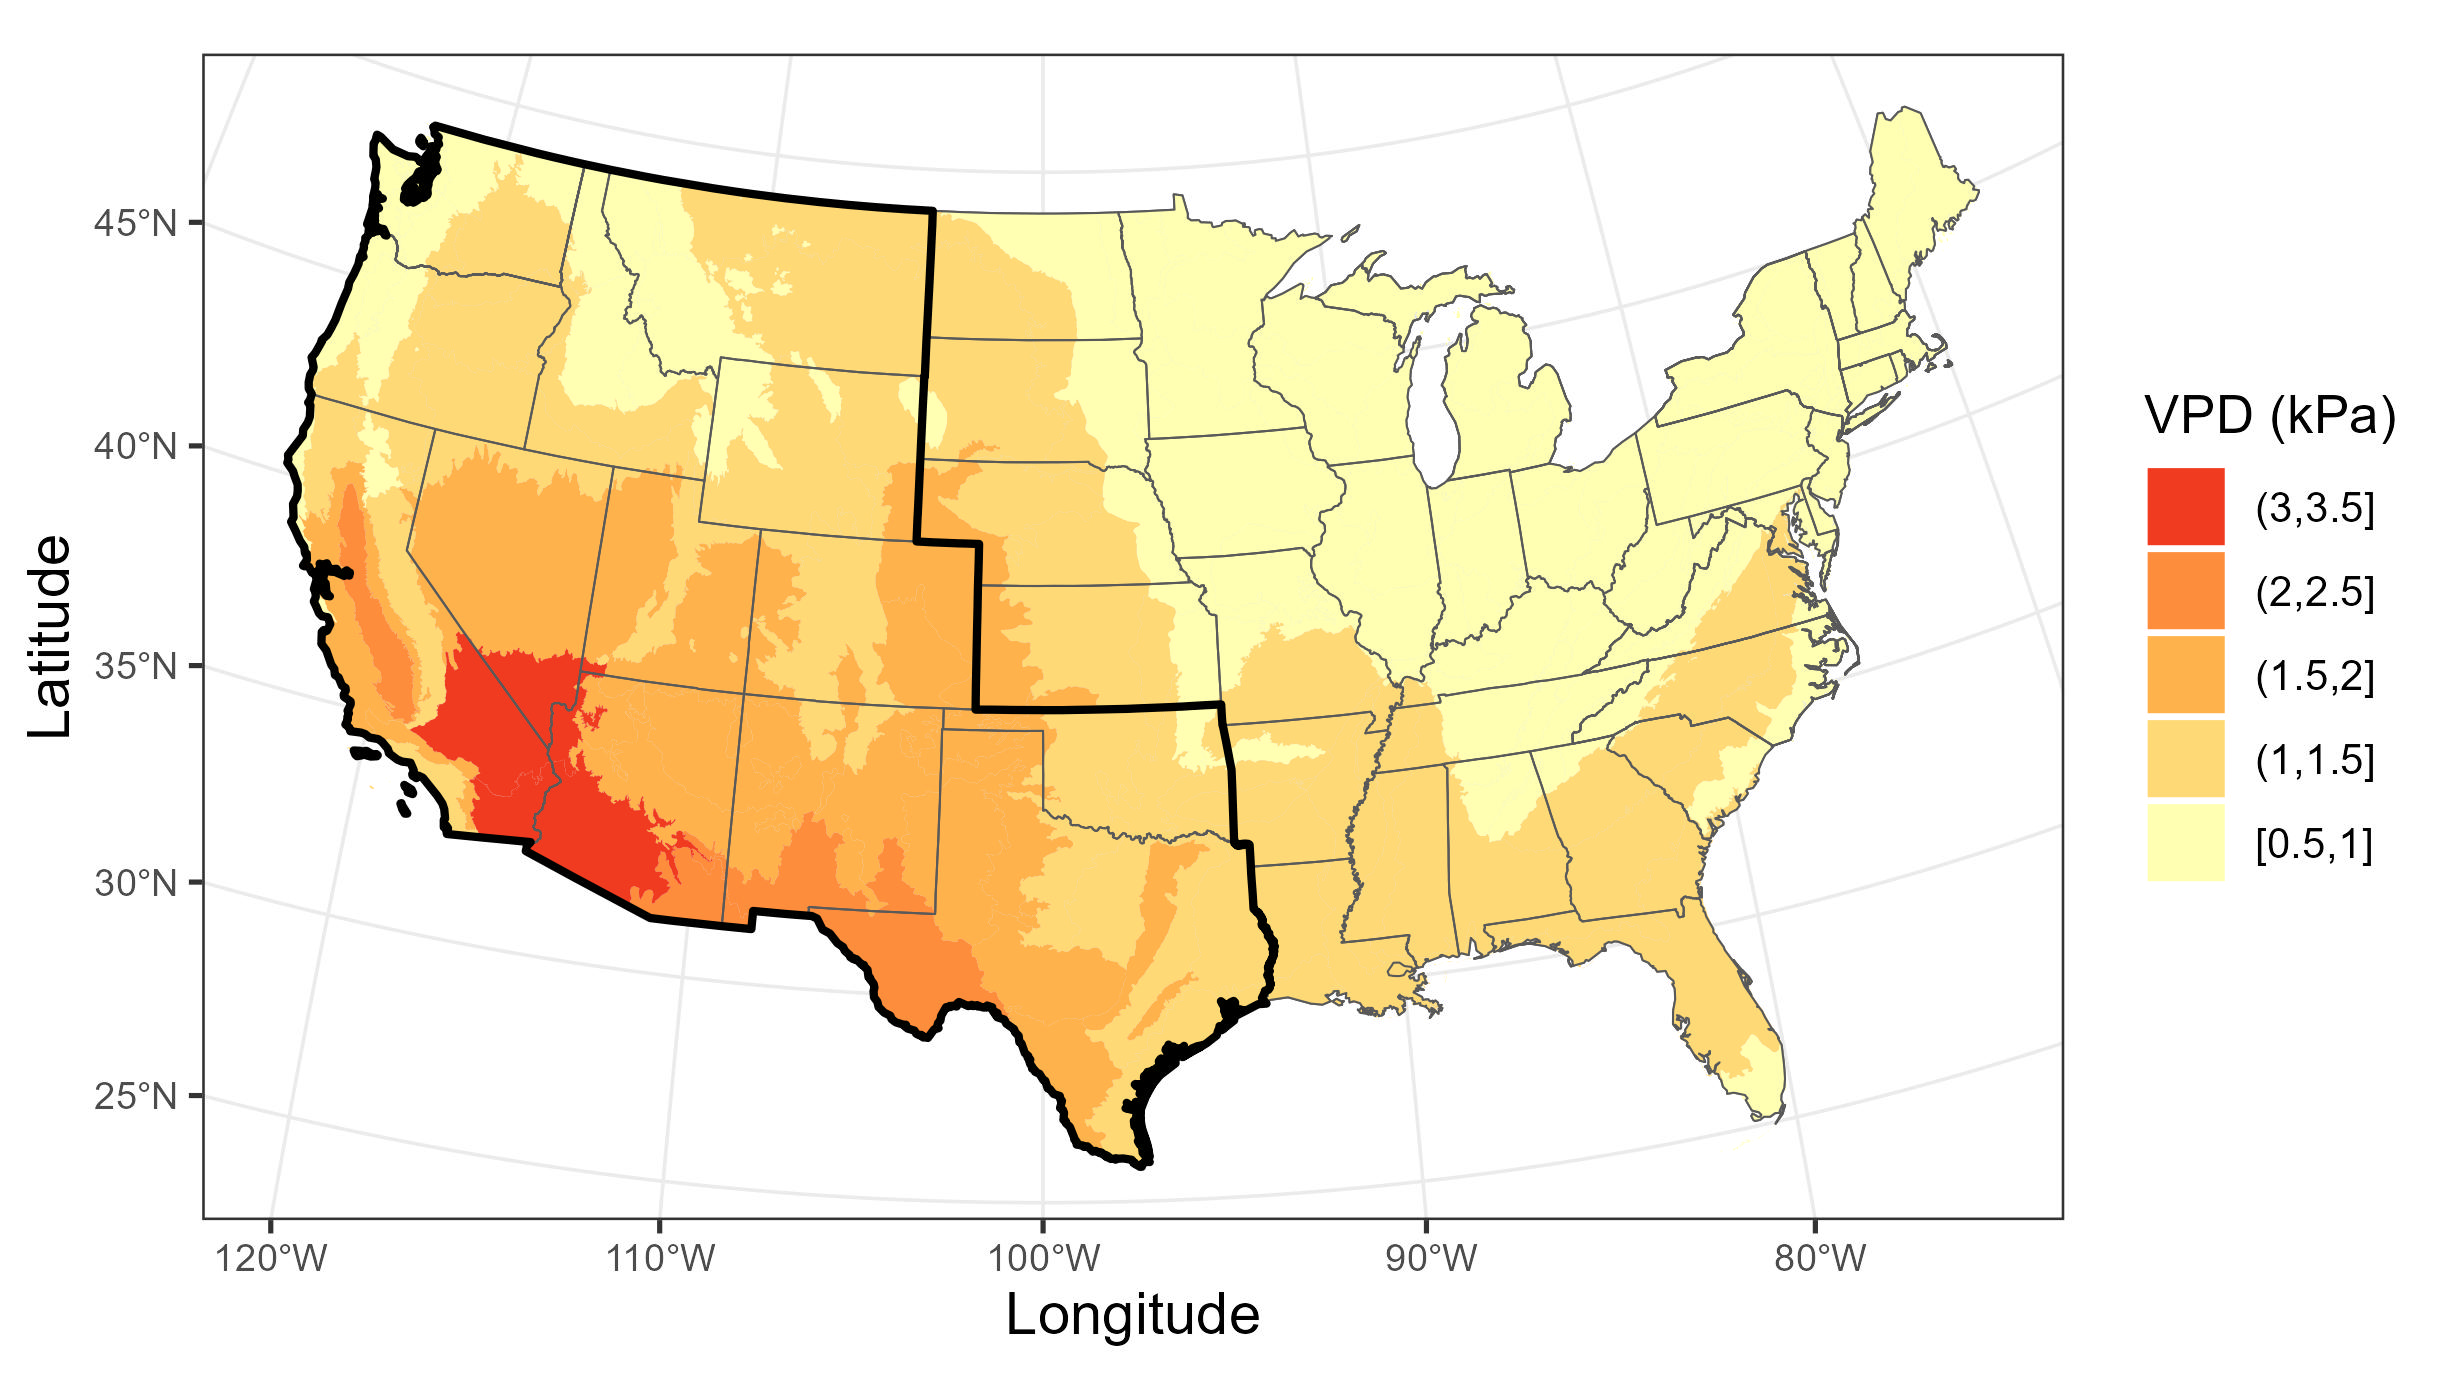
Data derived from GridMET. Model domain is denoted by black line.
Data derived from GridMET. Model domain is denoted by black line.
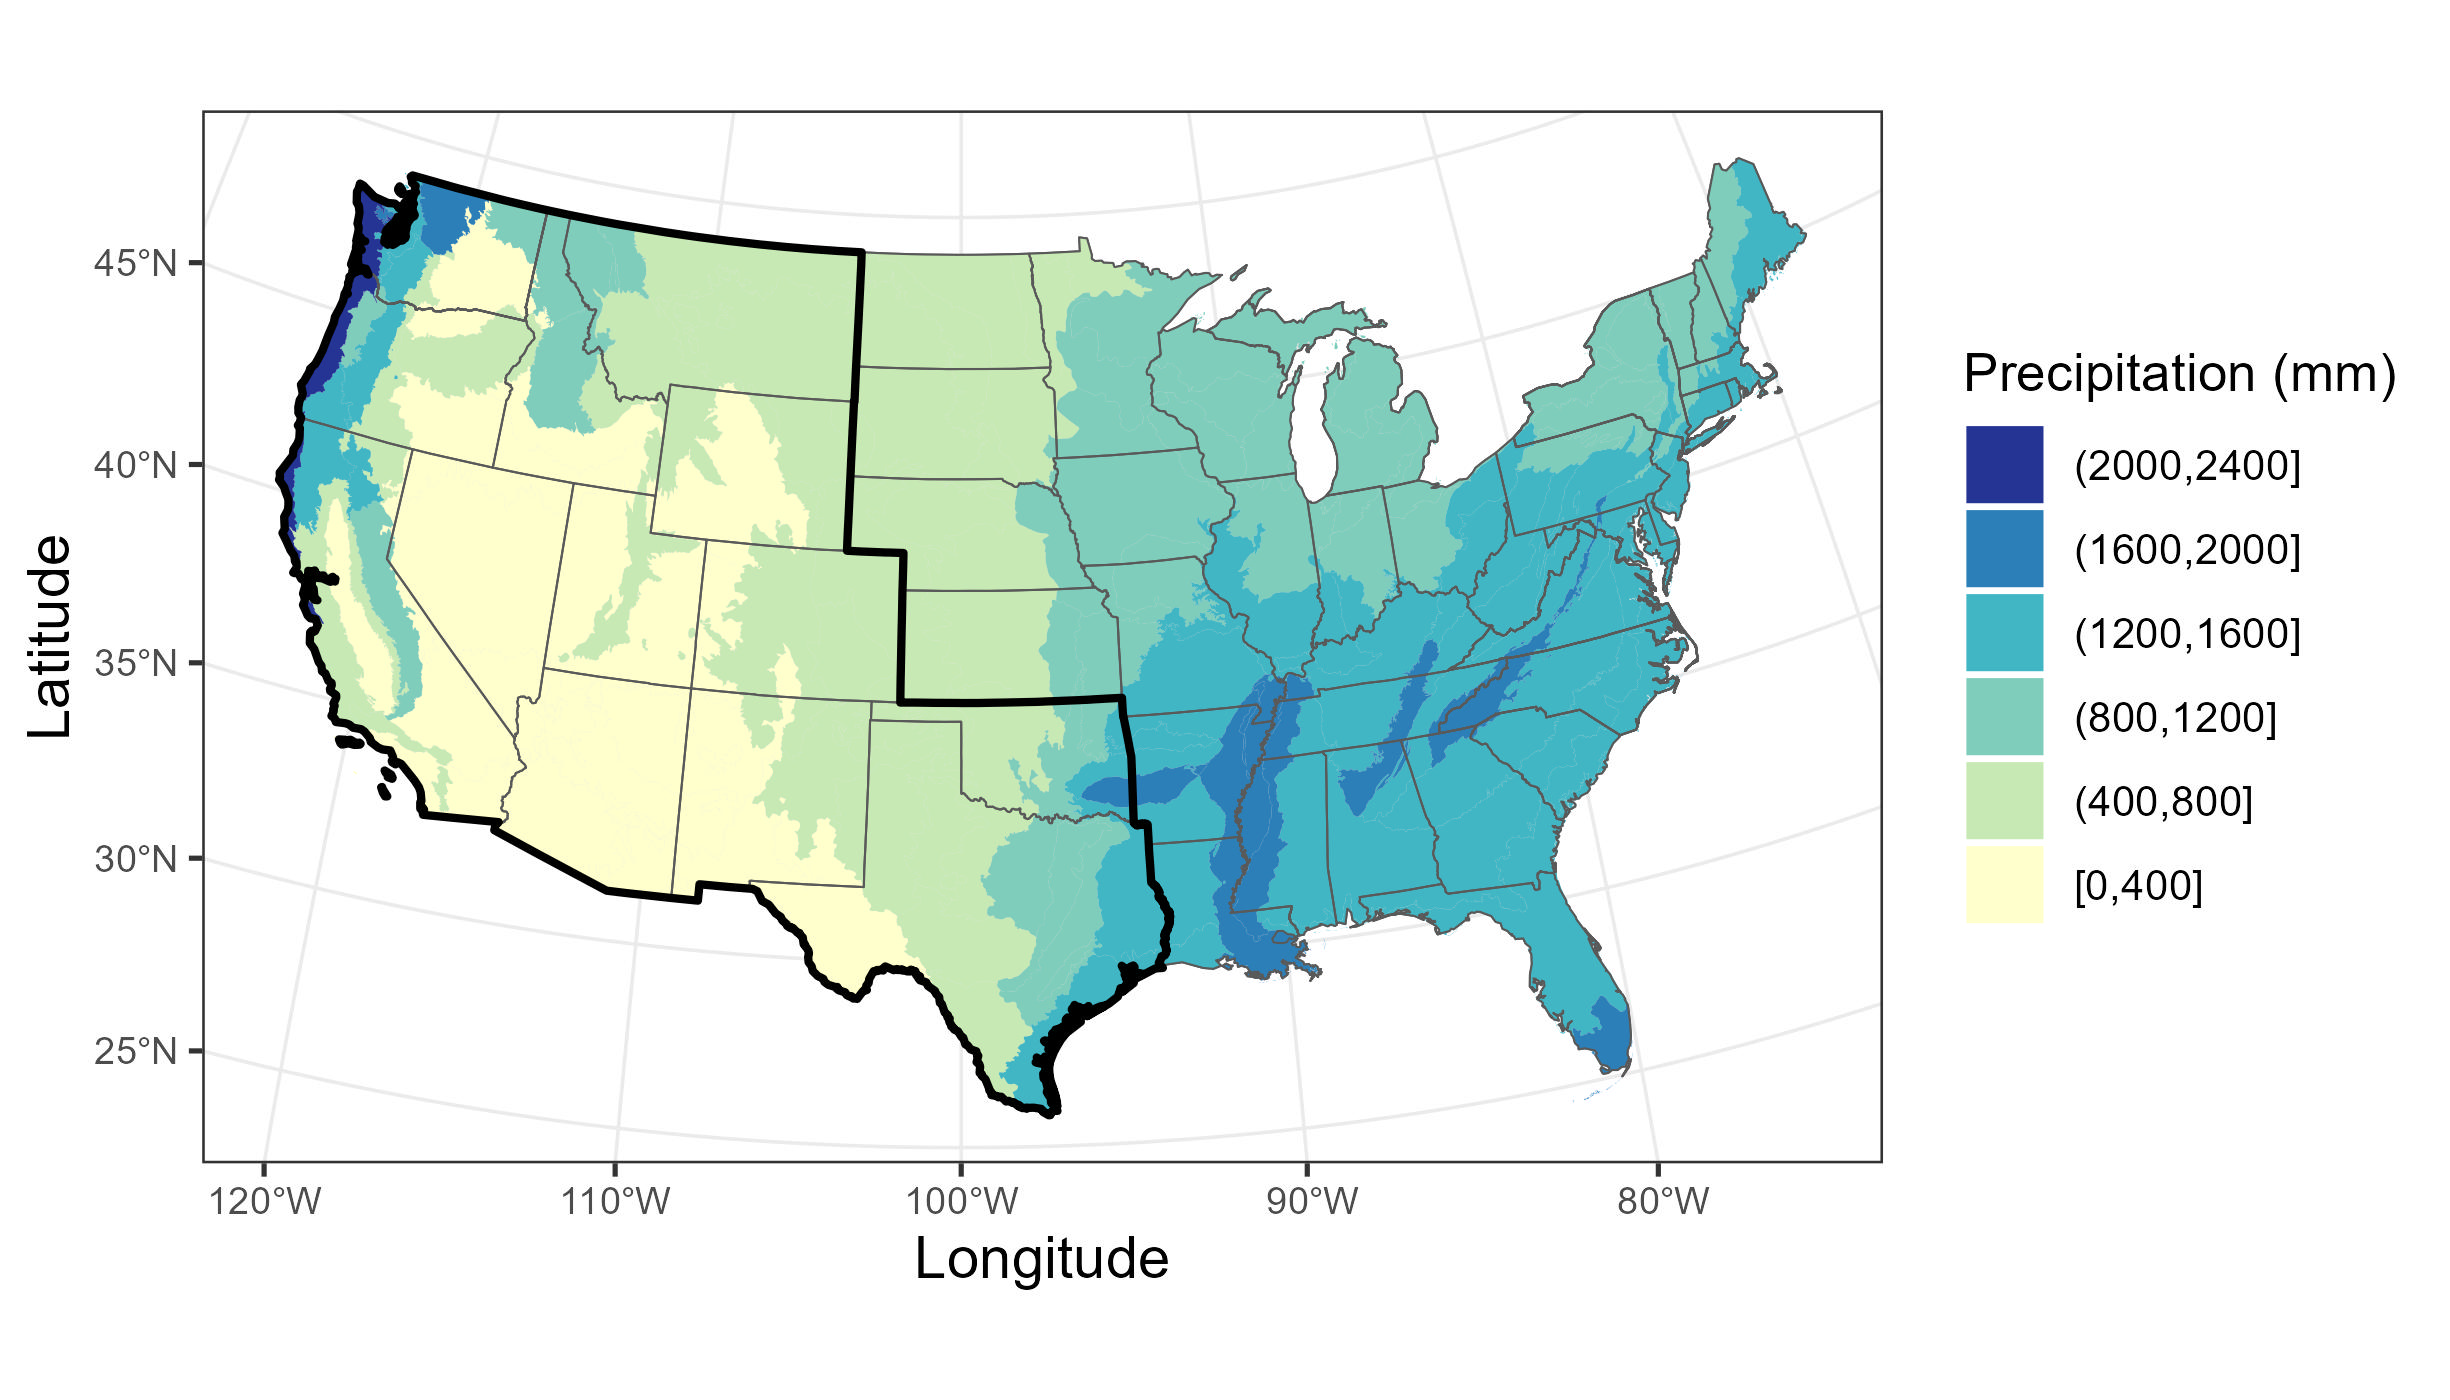
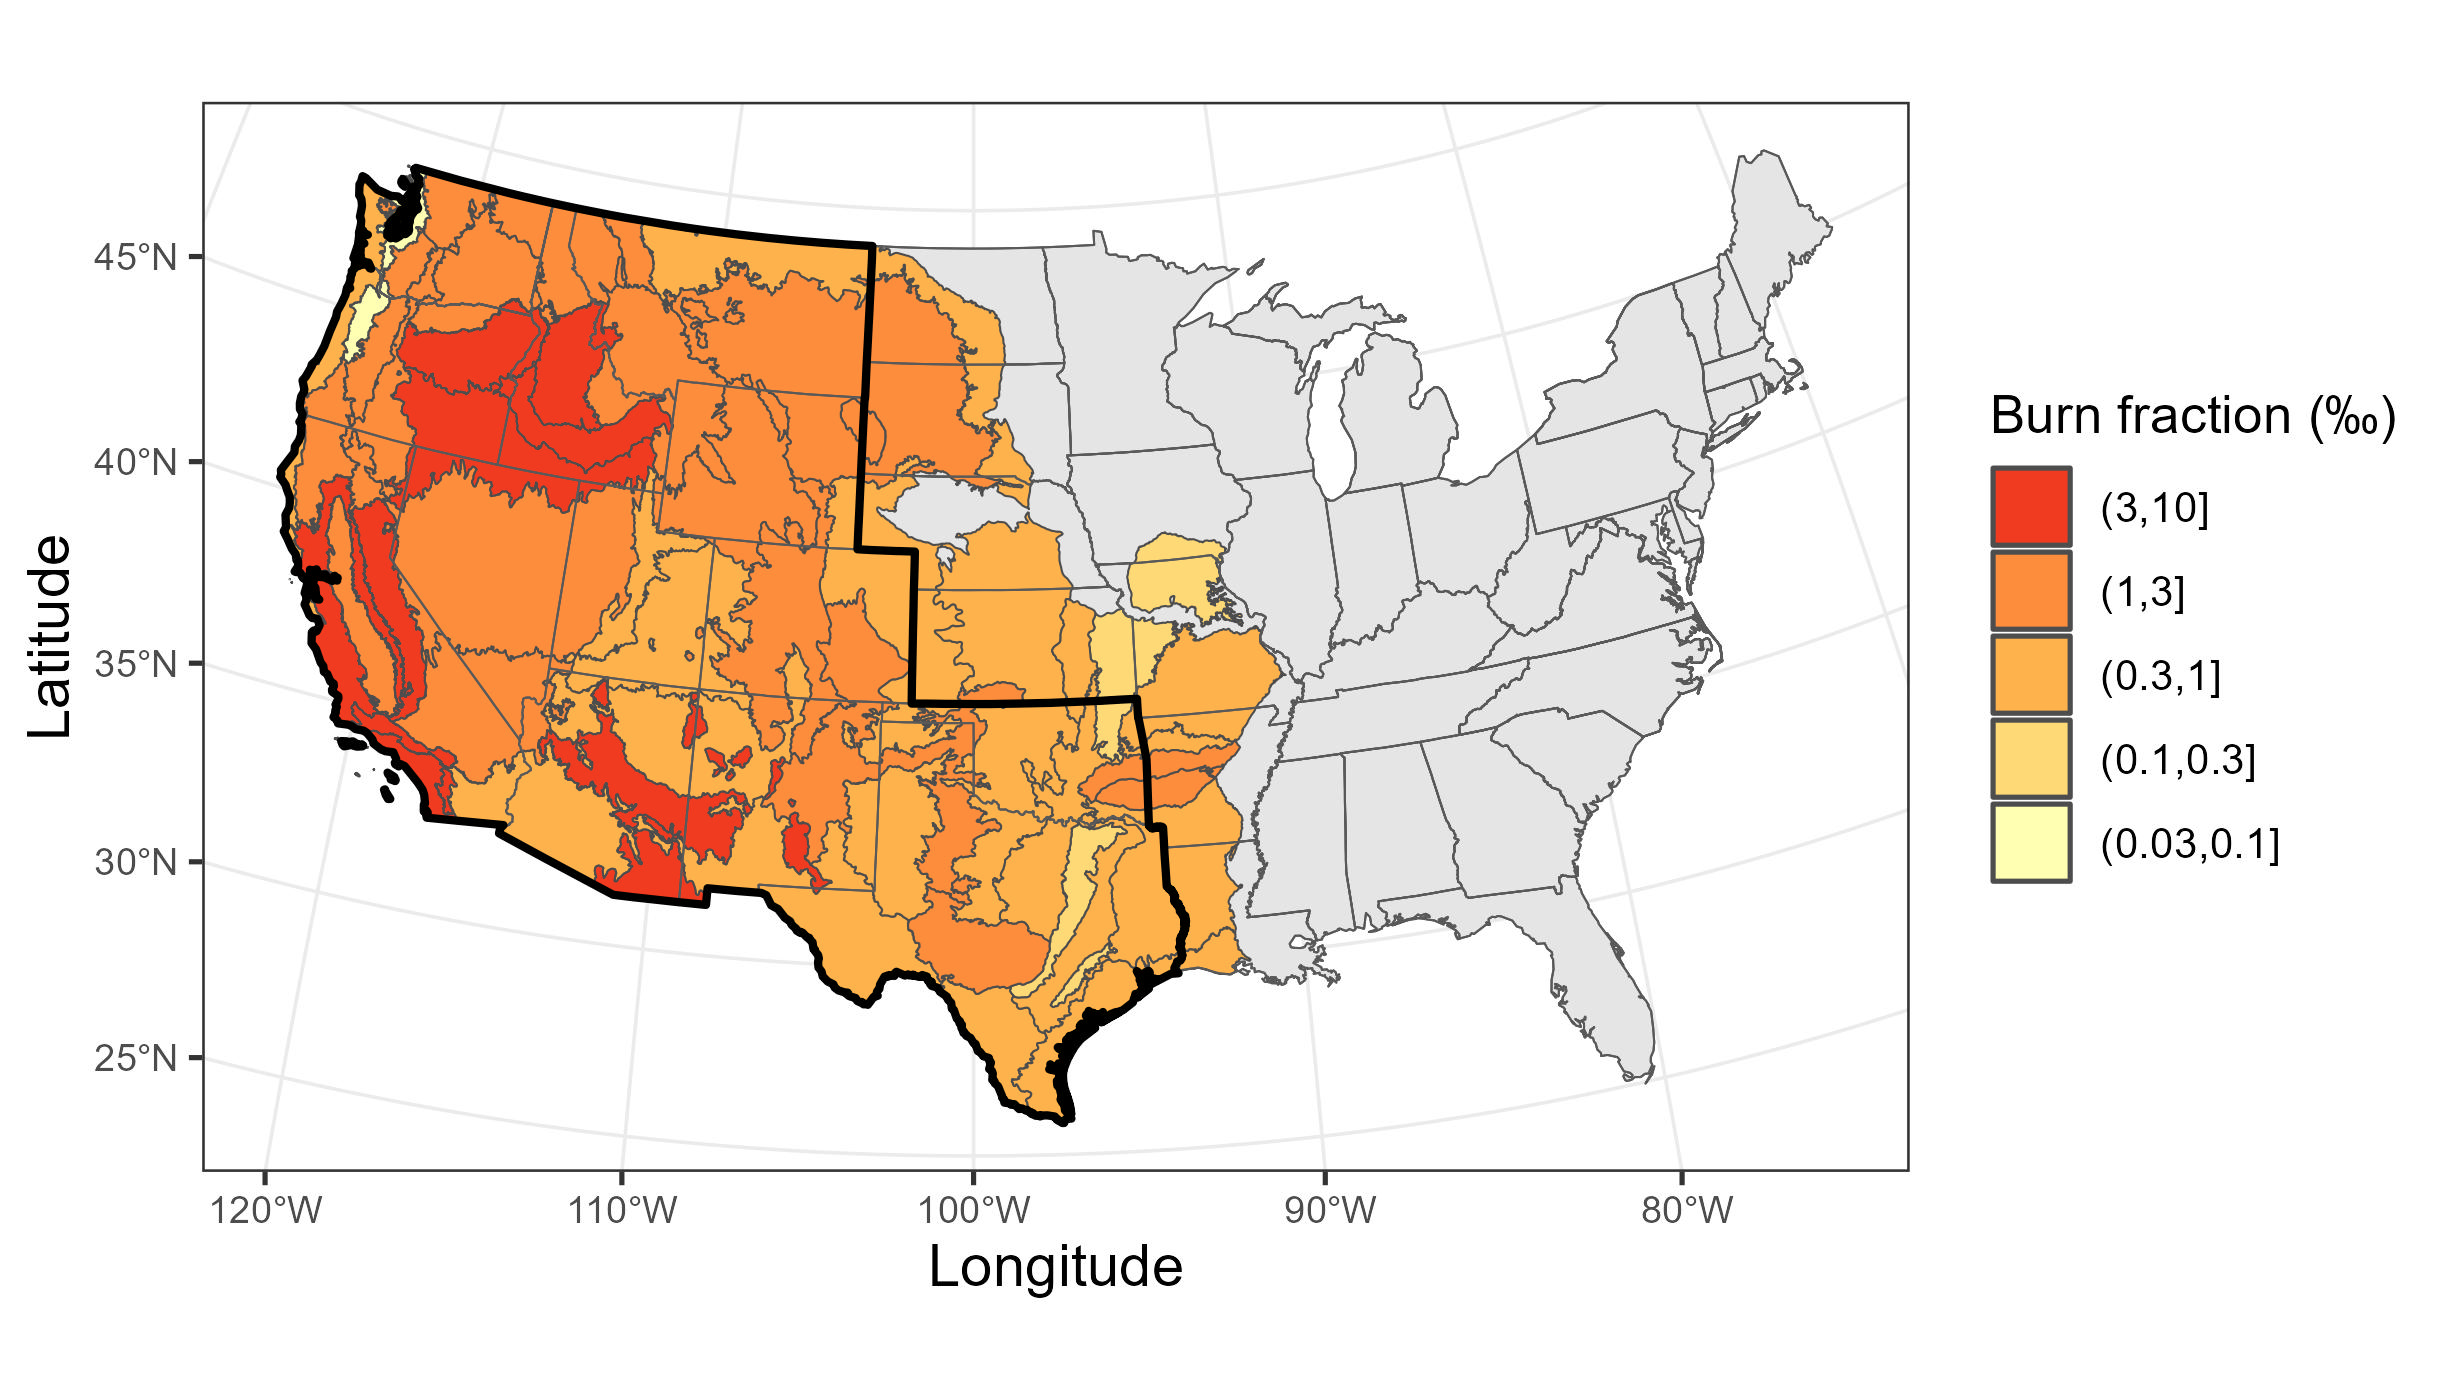
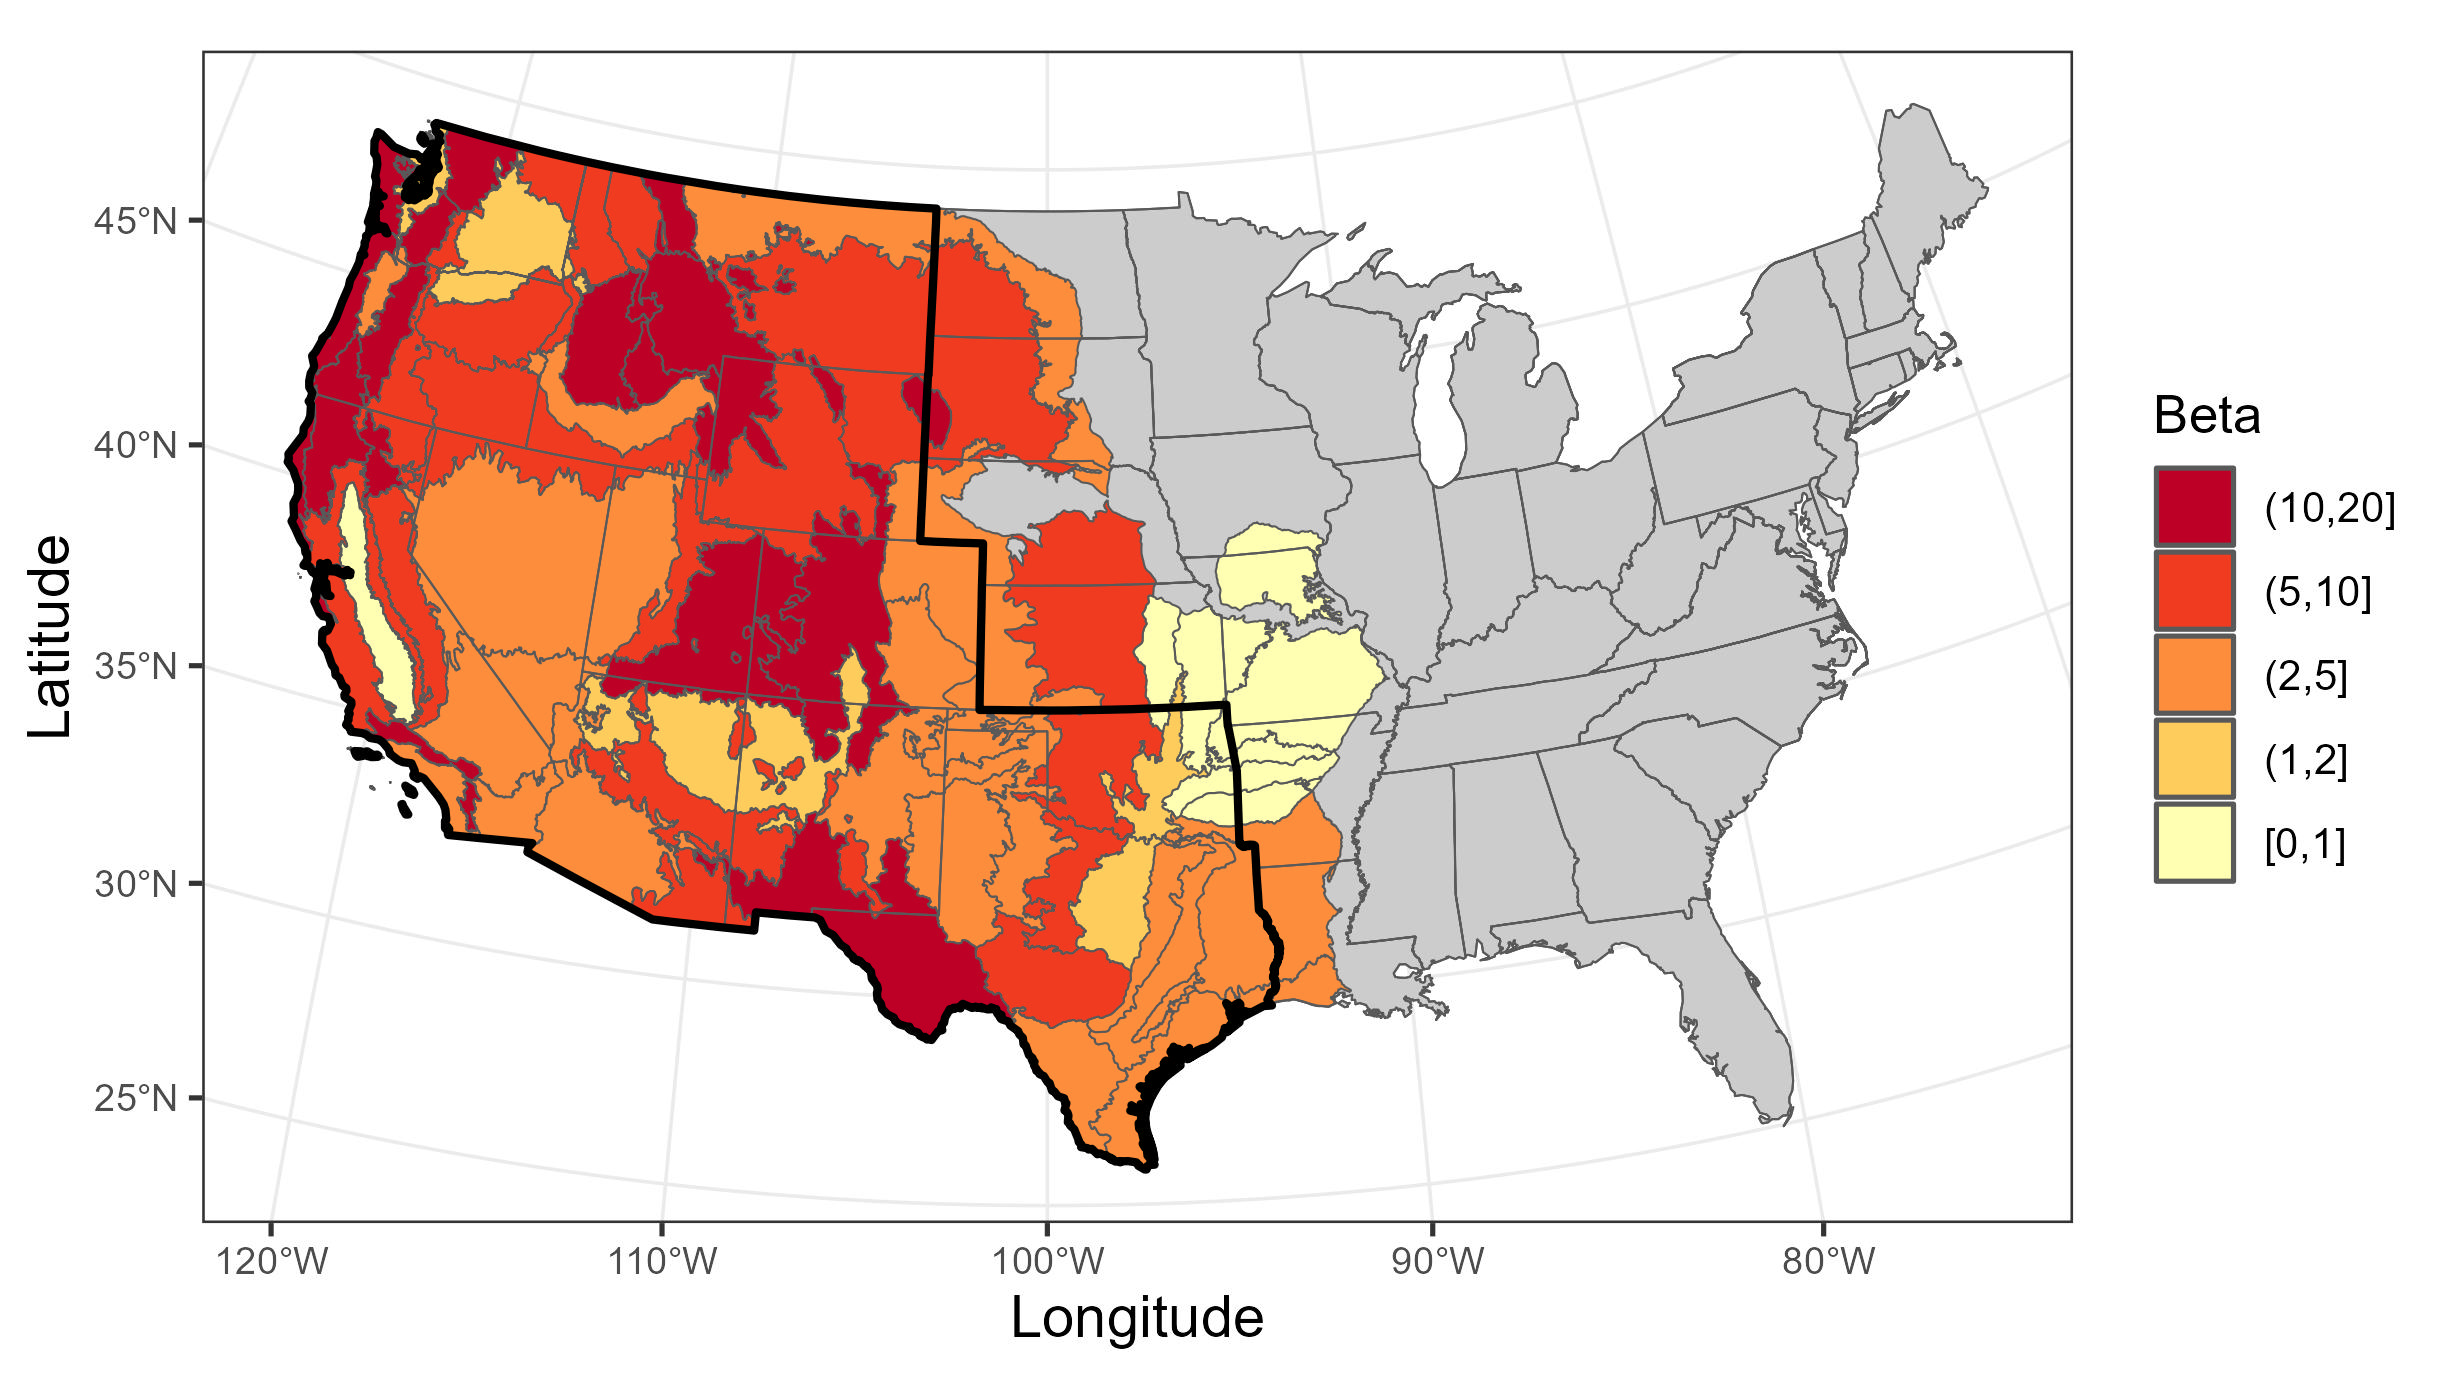
The Southern Rockies of Colorado (ecoregion 21) and Klamath Mountains of California (ecoregion 78) have relatively high burn fractions, greater than 1%, and are highly sensitive to VPD. Other ecoregions with relatively high burn fractions that are highly sensitive to VPD are the Middle Rockies (17), Canadian Rockies (41) and Idaho Batholith (16). These ecoregions are also heavily forested.
Other ecoregions that are highly sensitive to VPD include Coast Range (1), along the northwest coastline, the Cascades (4) which lies across Washington, Oregon, and northern California, and the Southern California Mountains (8). Coast Range (1) has historically had a relatively low burn fraction (less than 1%) while the Southern California Mountains (8) has the highest burn fraction in the model domain, greater than 5%.
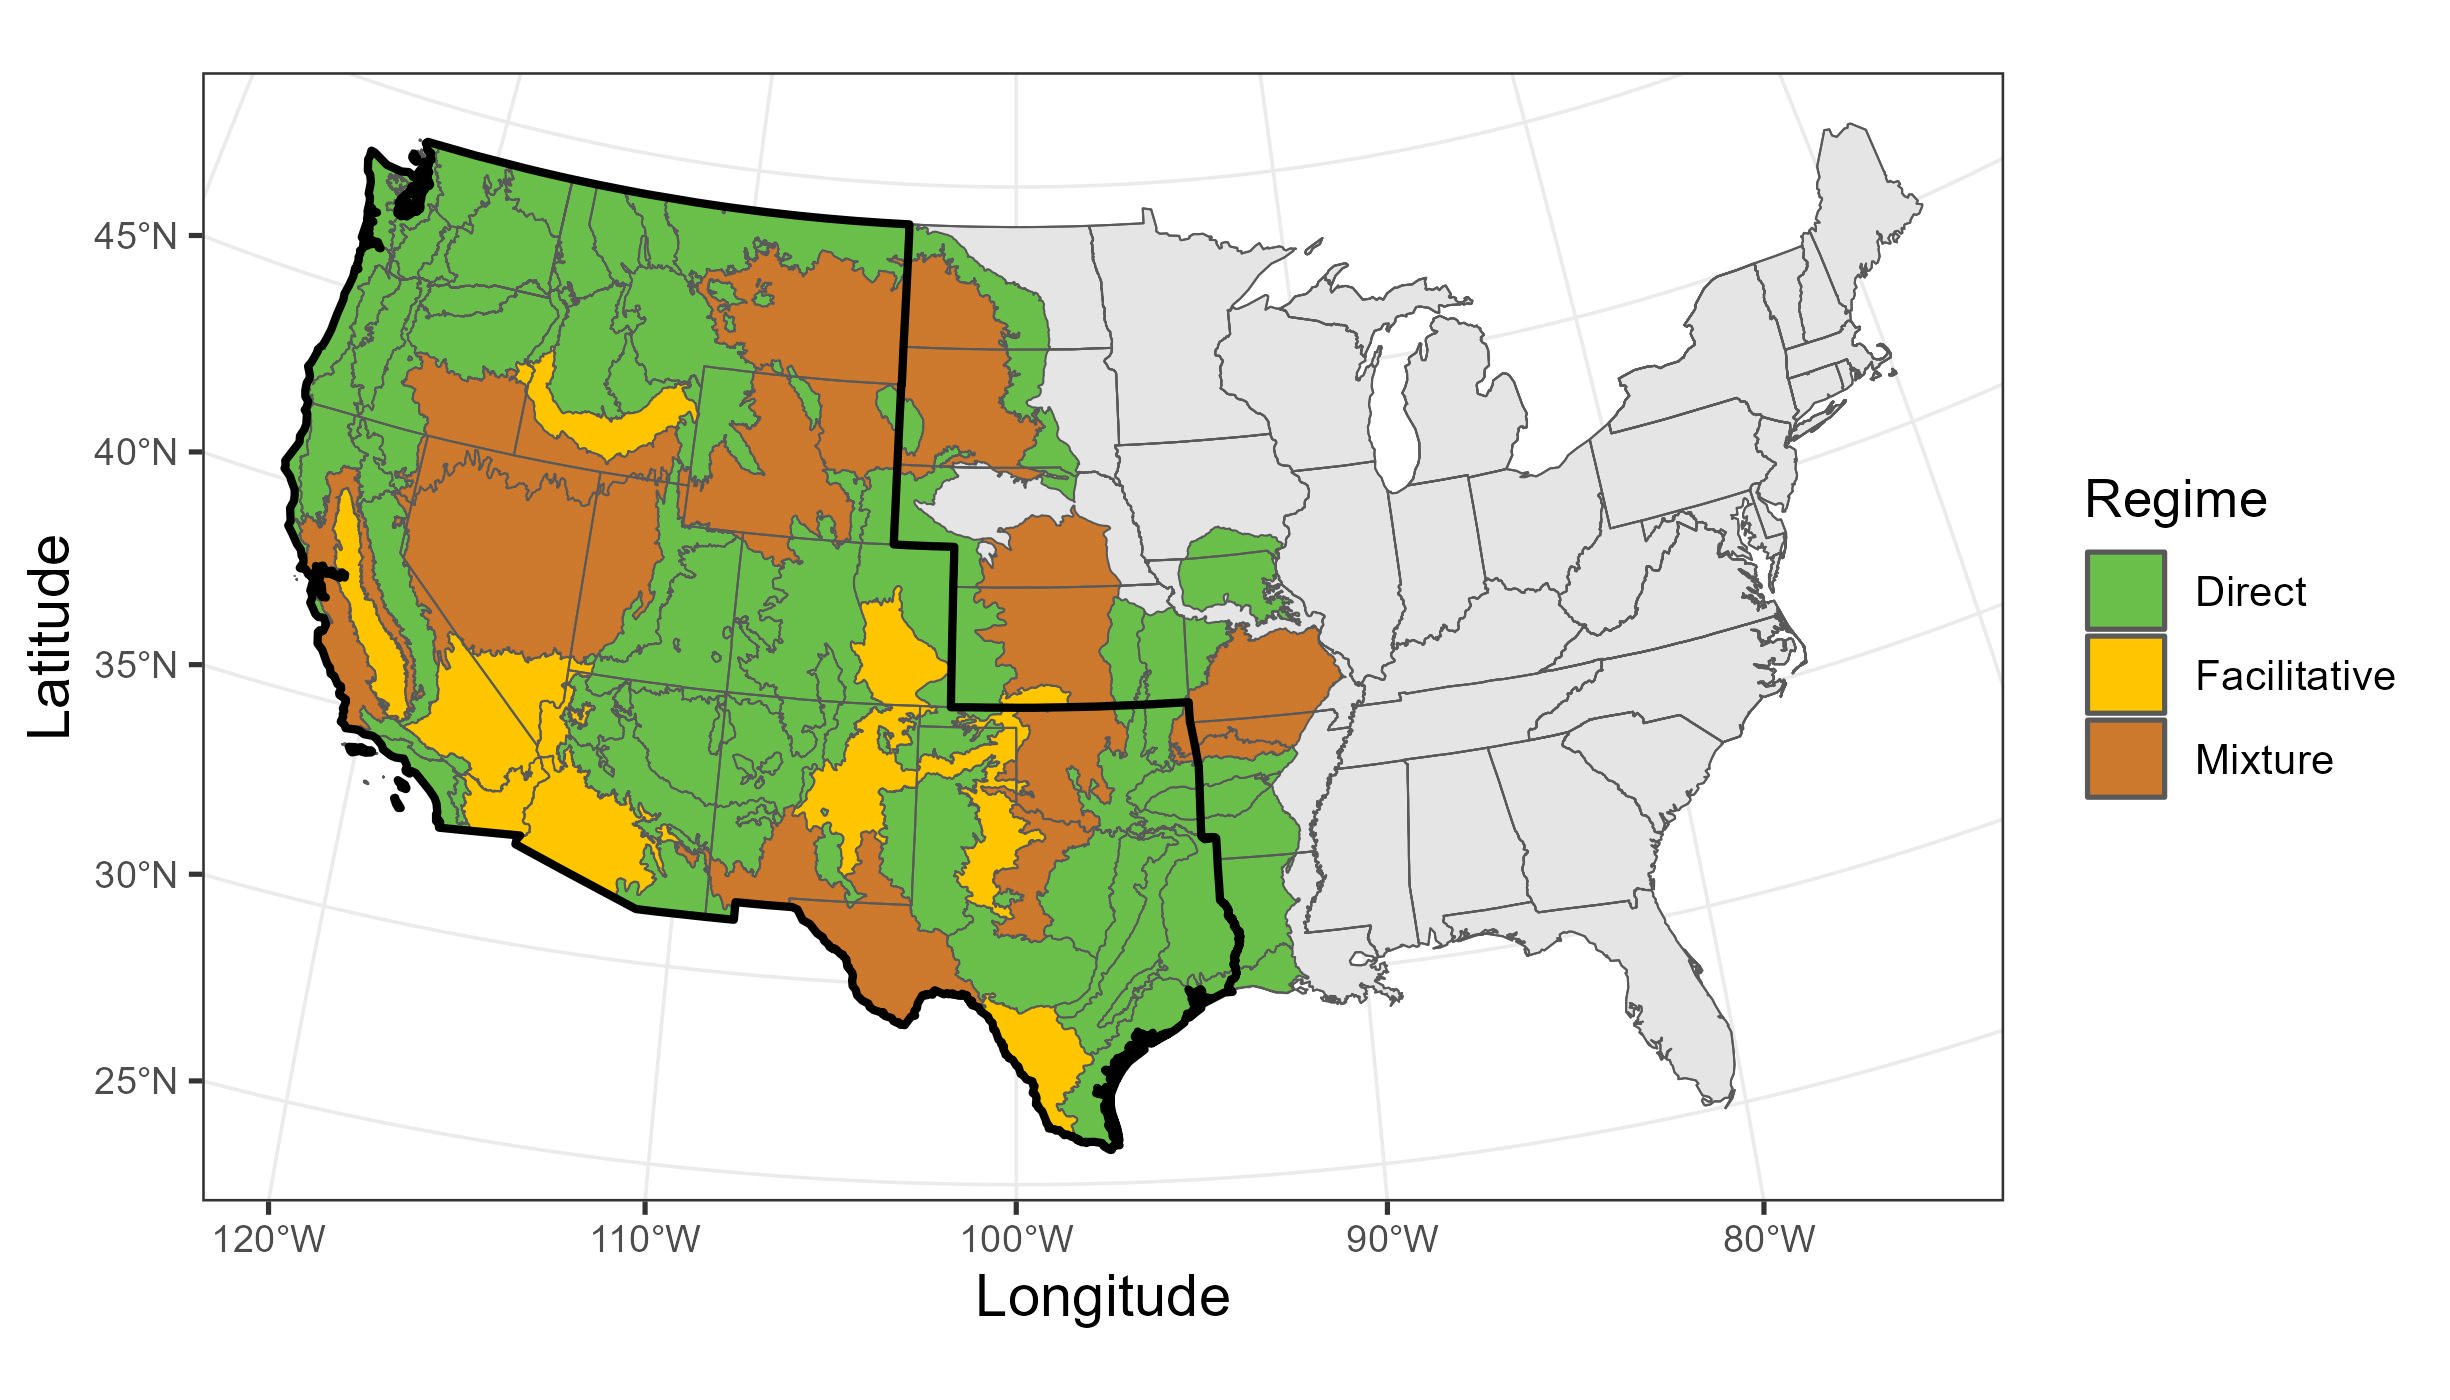
Ecoregions where climate has a direct influence, through VPD, tend to have higher forest coverage. The converse is also true: facilitative ecoregions are either desert (ecoregions 14 and 81) or agricultural land (7 and 12). These ecoregions are weakly sensitive to precipitation changes.
Average annual burn fraction is the average annual burn area per ecoregion area. Data derived from the 10,000-year catalog. Model domain is denoted by black line.
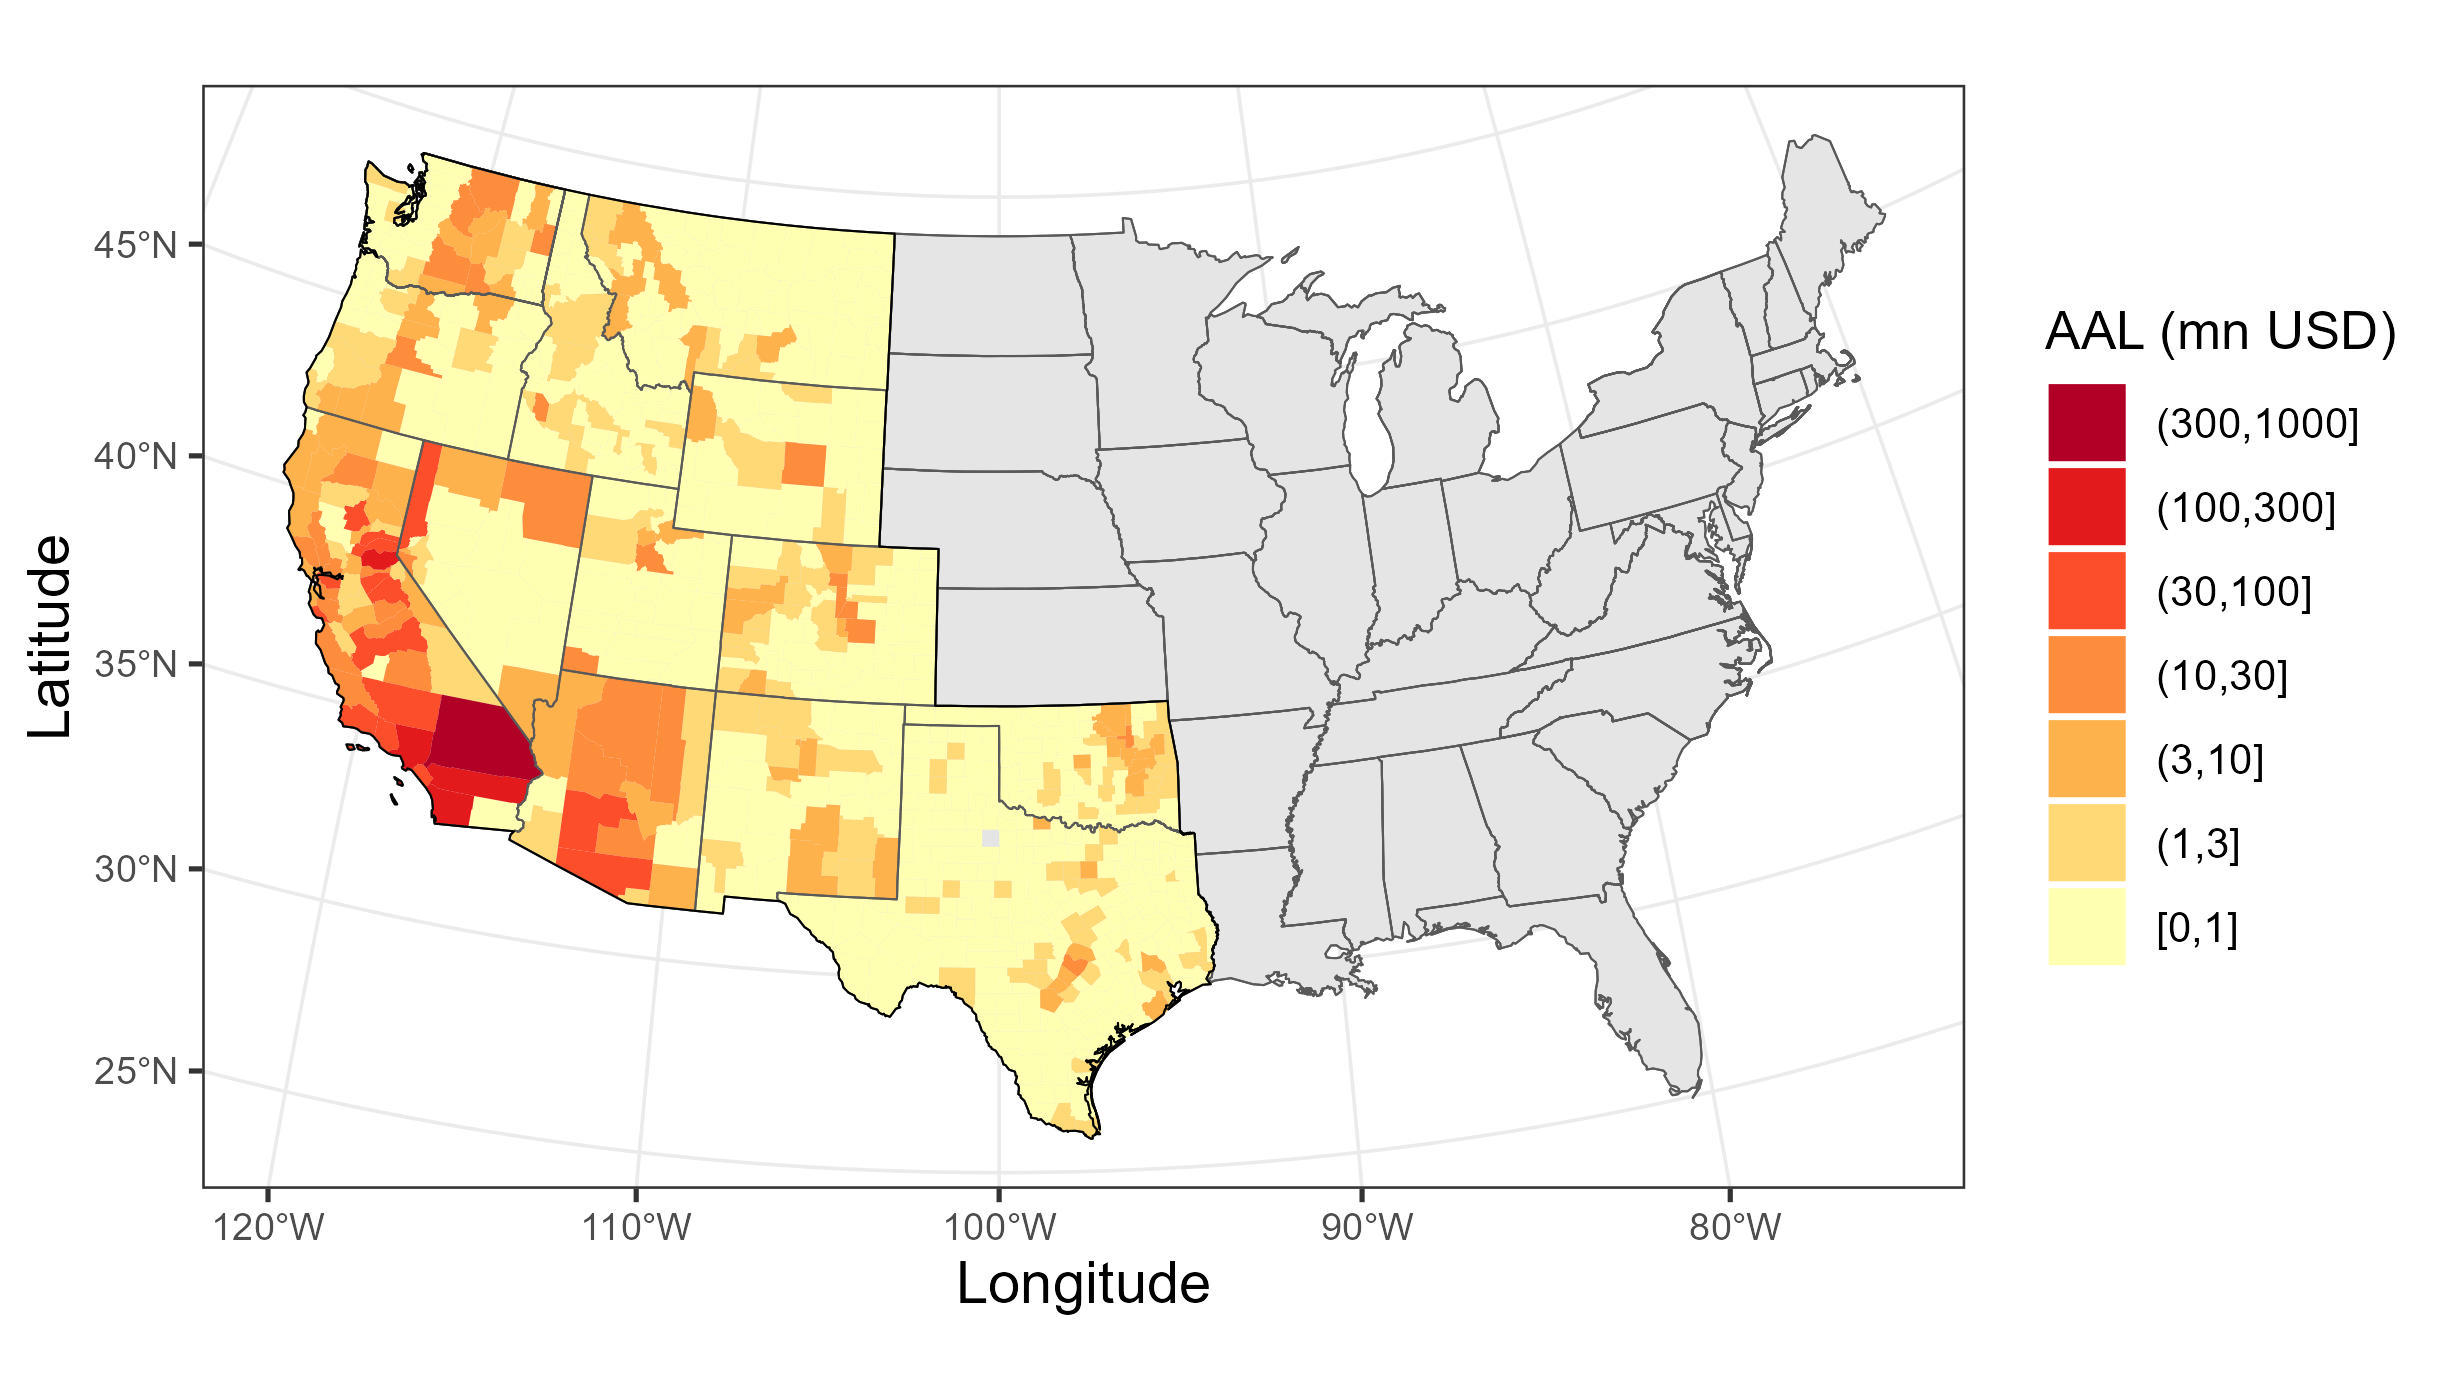
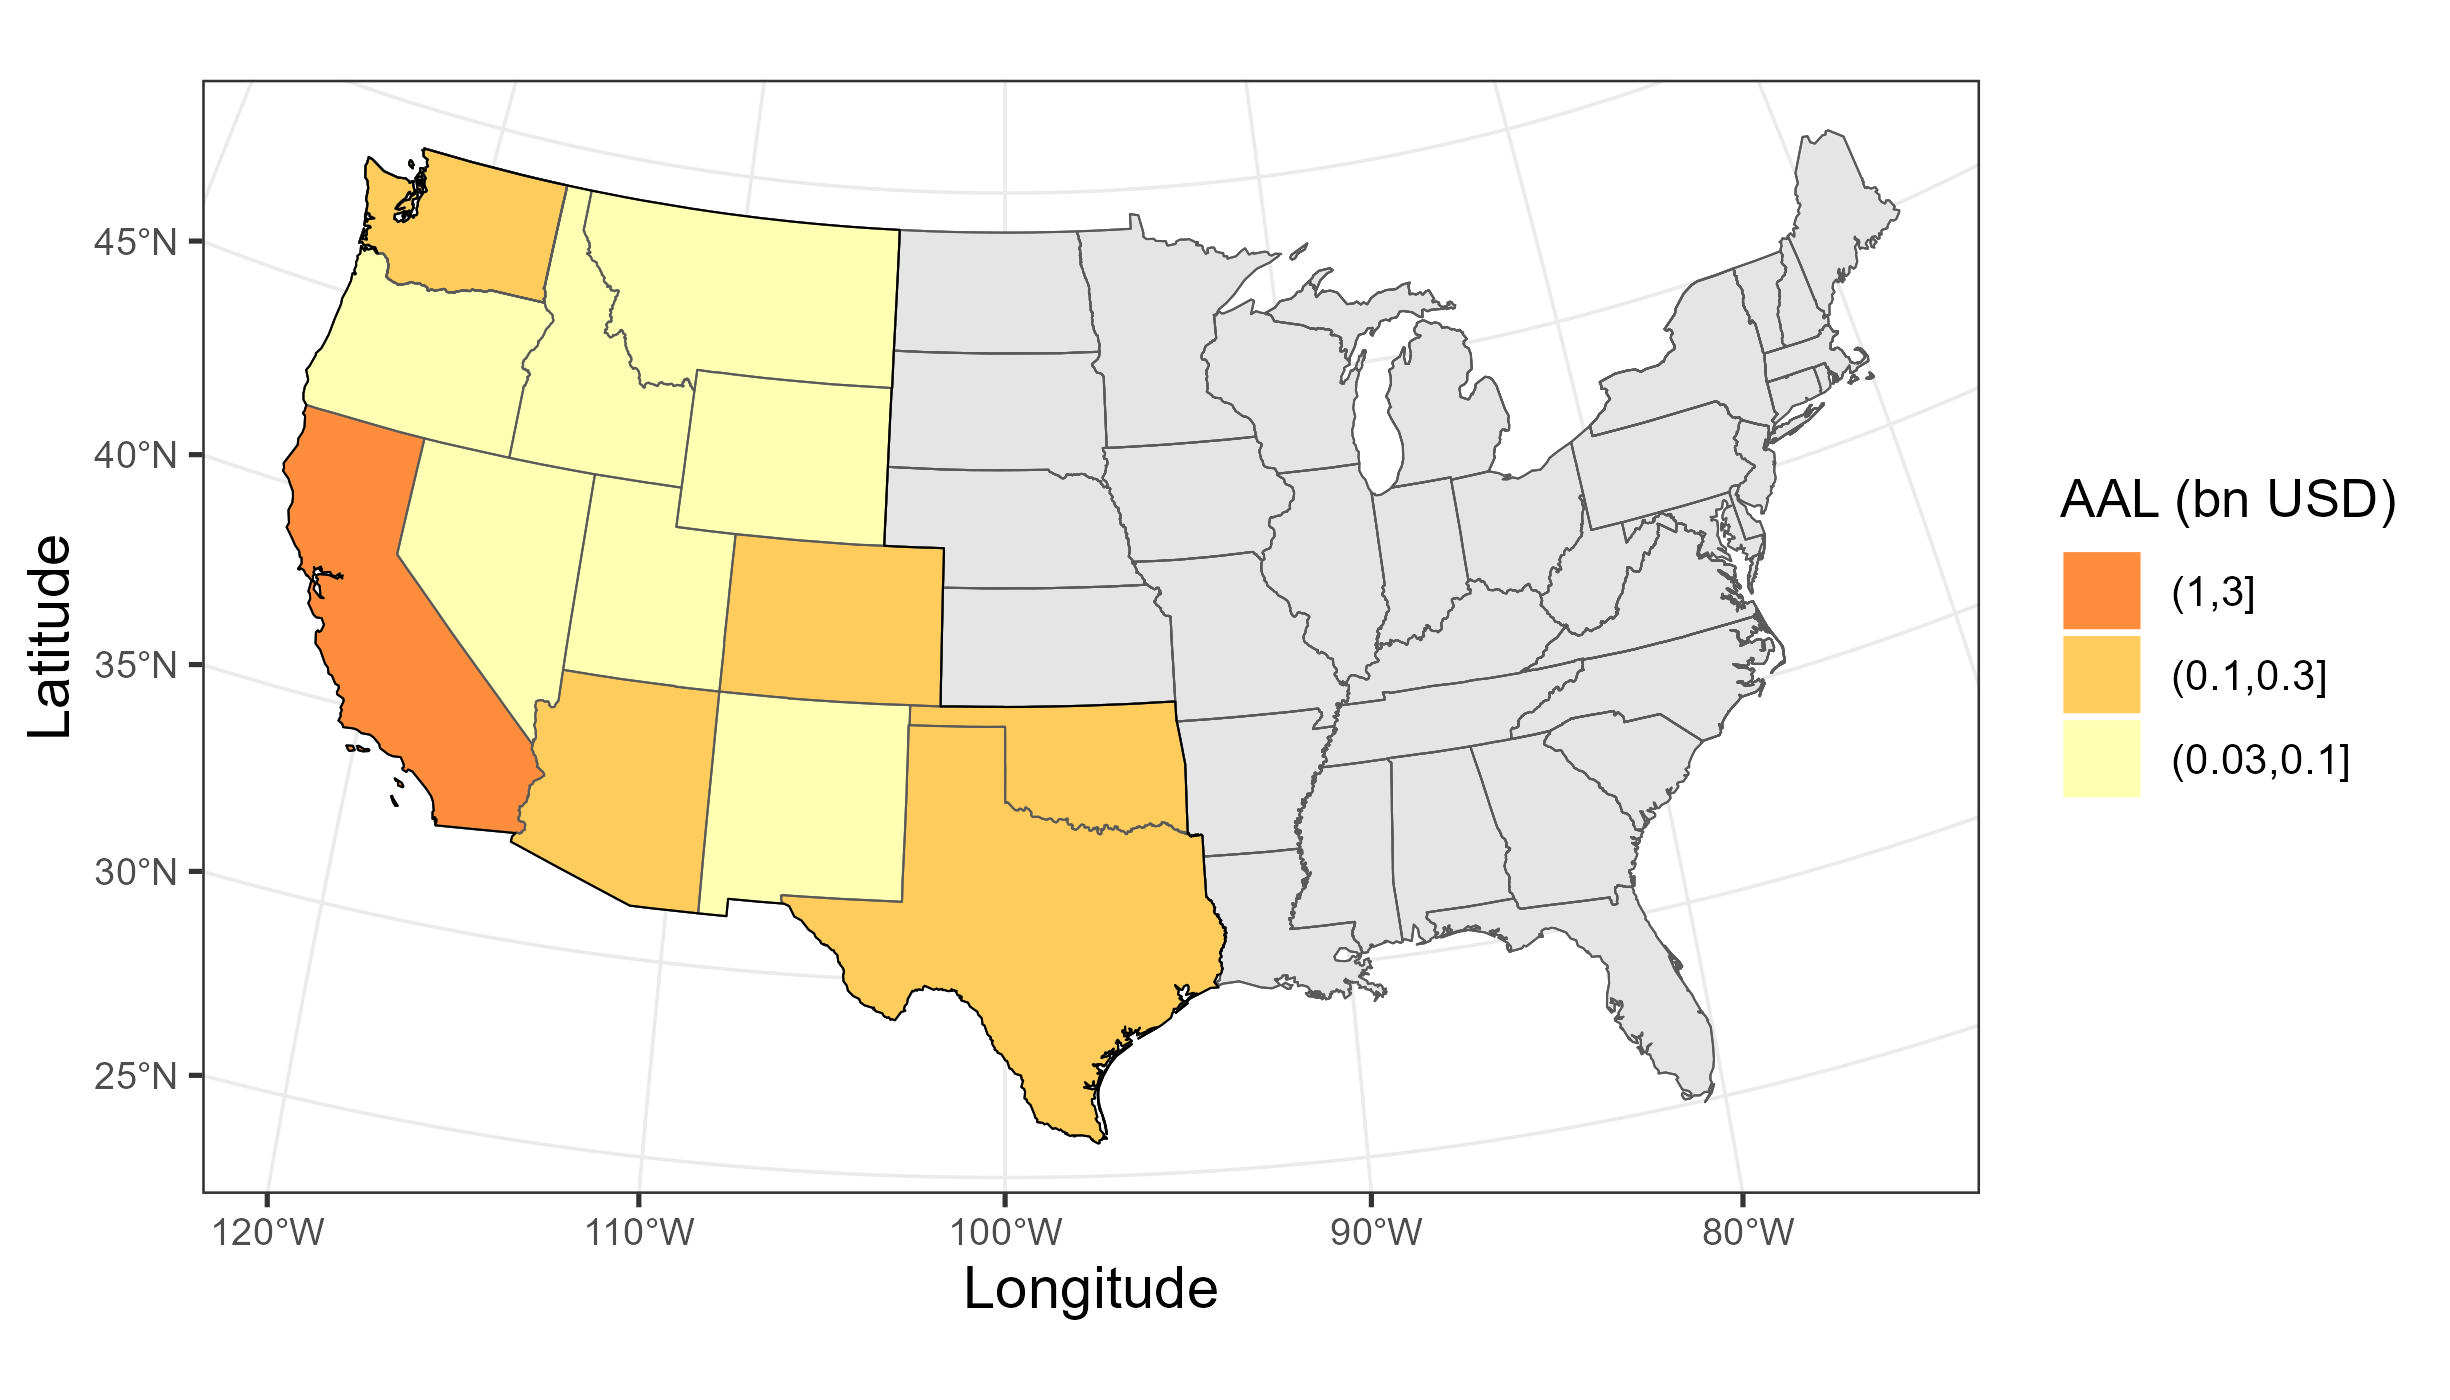
How hazard risk translates into loss risk depends on exposure and its vulnerability. Average annual loss (AAL) for each county in the Verisk Wildfire Model for the United States domain based on the 10,000-year catalog and Average annual loss (AAL) for each state in the Verisk Wildfire Model for the United States domain based on the 10,000-year catalog show the industry AAL by county and state respectively based on the 10,000-year catalog. Counties with the highest AAL are in southern California in San Bernadino, Riverside (Palm Springs) and Los Angeles. AAL is moderately high in southern Arizona (Phoenix), central California (Sacramento) and western Nevada (Reno). Risk is also notable in Texas and Washington.
California contributes around two-thirds of the overall AAL estimated by the model. Arizona contributes 7% and Texas, Washington, and Colorado contribute about 4% each. In these states, some ecoregions are highly sensitive to VPD, most notably ecoregions in northern and southern California, central and western Colorado, and central and western Washington. Although Montana has the third lowest AAL of all states, its losses are concentrated in the west near ecoregions 4 and 17 that are highly sensitive to VPD. Ten ecoregions that contribute the most to the industry average annual loss (AAL), including their AAL contribution (%) and fire-climate sensitivity (highest β regression parameter in the statistical model) displays the top ten ecoregions that have the highest contributions to the industry AAL and their fire-climate sensitivity as defined by the highest β regression parameter in the statistical model. Seven of the top ten are fully or partially in California. Ecoregions 8 (California) and 21 (Colorado) have the highest fire-climate sensitivity of the top ten.
The projected impact of climate change on modeled wildfire hazard and loss risk is presented in the following section.
|
Rank |
Ecoregion |
Name |
AAL (%) |
Fire-climate sensitivity (-) |
|---|---|---|---|---|
|
1 |
85 |
Southern California/Northern Baja Coast |
27% |
2.3 |
|
2 |
6 |
Central California Foothills and Coastal Mountains |
17% |
7.2 |
|
3 |
8 |
Southern California Mountains |
9% |
13.7 |
|
4 |
5 |
Sierra Nevada |
7% |
7.9 |
|
5 |
81 |
Northern Basin and Range |
5% |
2.5 |
|
6 |
10 |
Columbia Plateau |
3% |
1.1 |
|
7 |
13 |
Central Basin and Range |
3% |
4.8 |
|
8 |
21 |
Southern Rockies |
3% |
12.3 |
|
9 |
23 |
Arizona/New Mexico Mountains |
2% |
5.2 |
|
10 |
14 |
Mojave Basin and Range |
2% |
2.4 |
