Future burn area projections
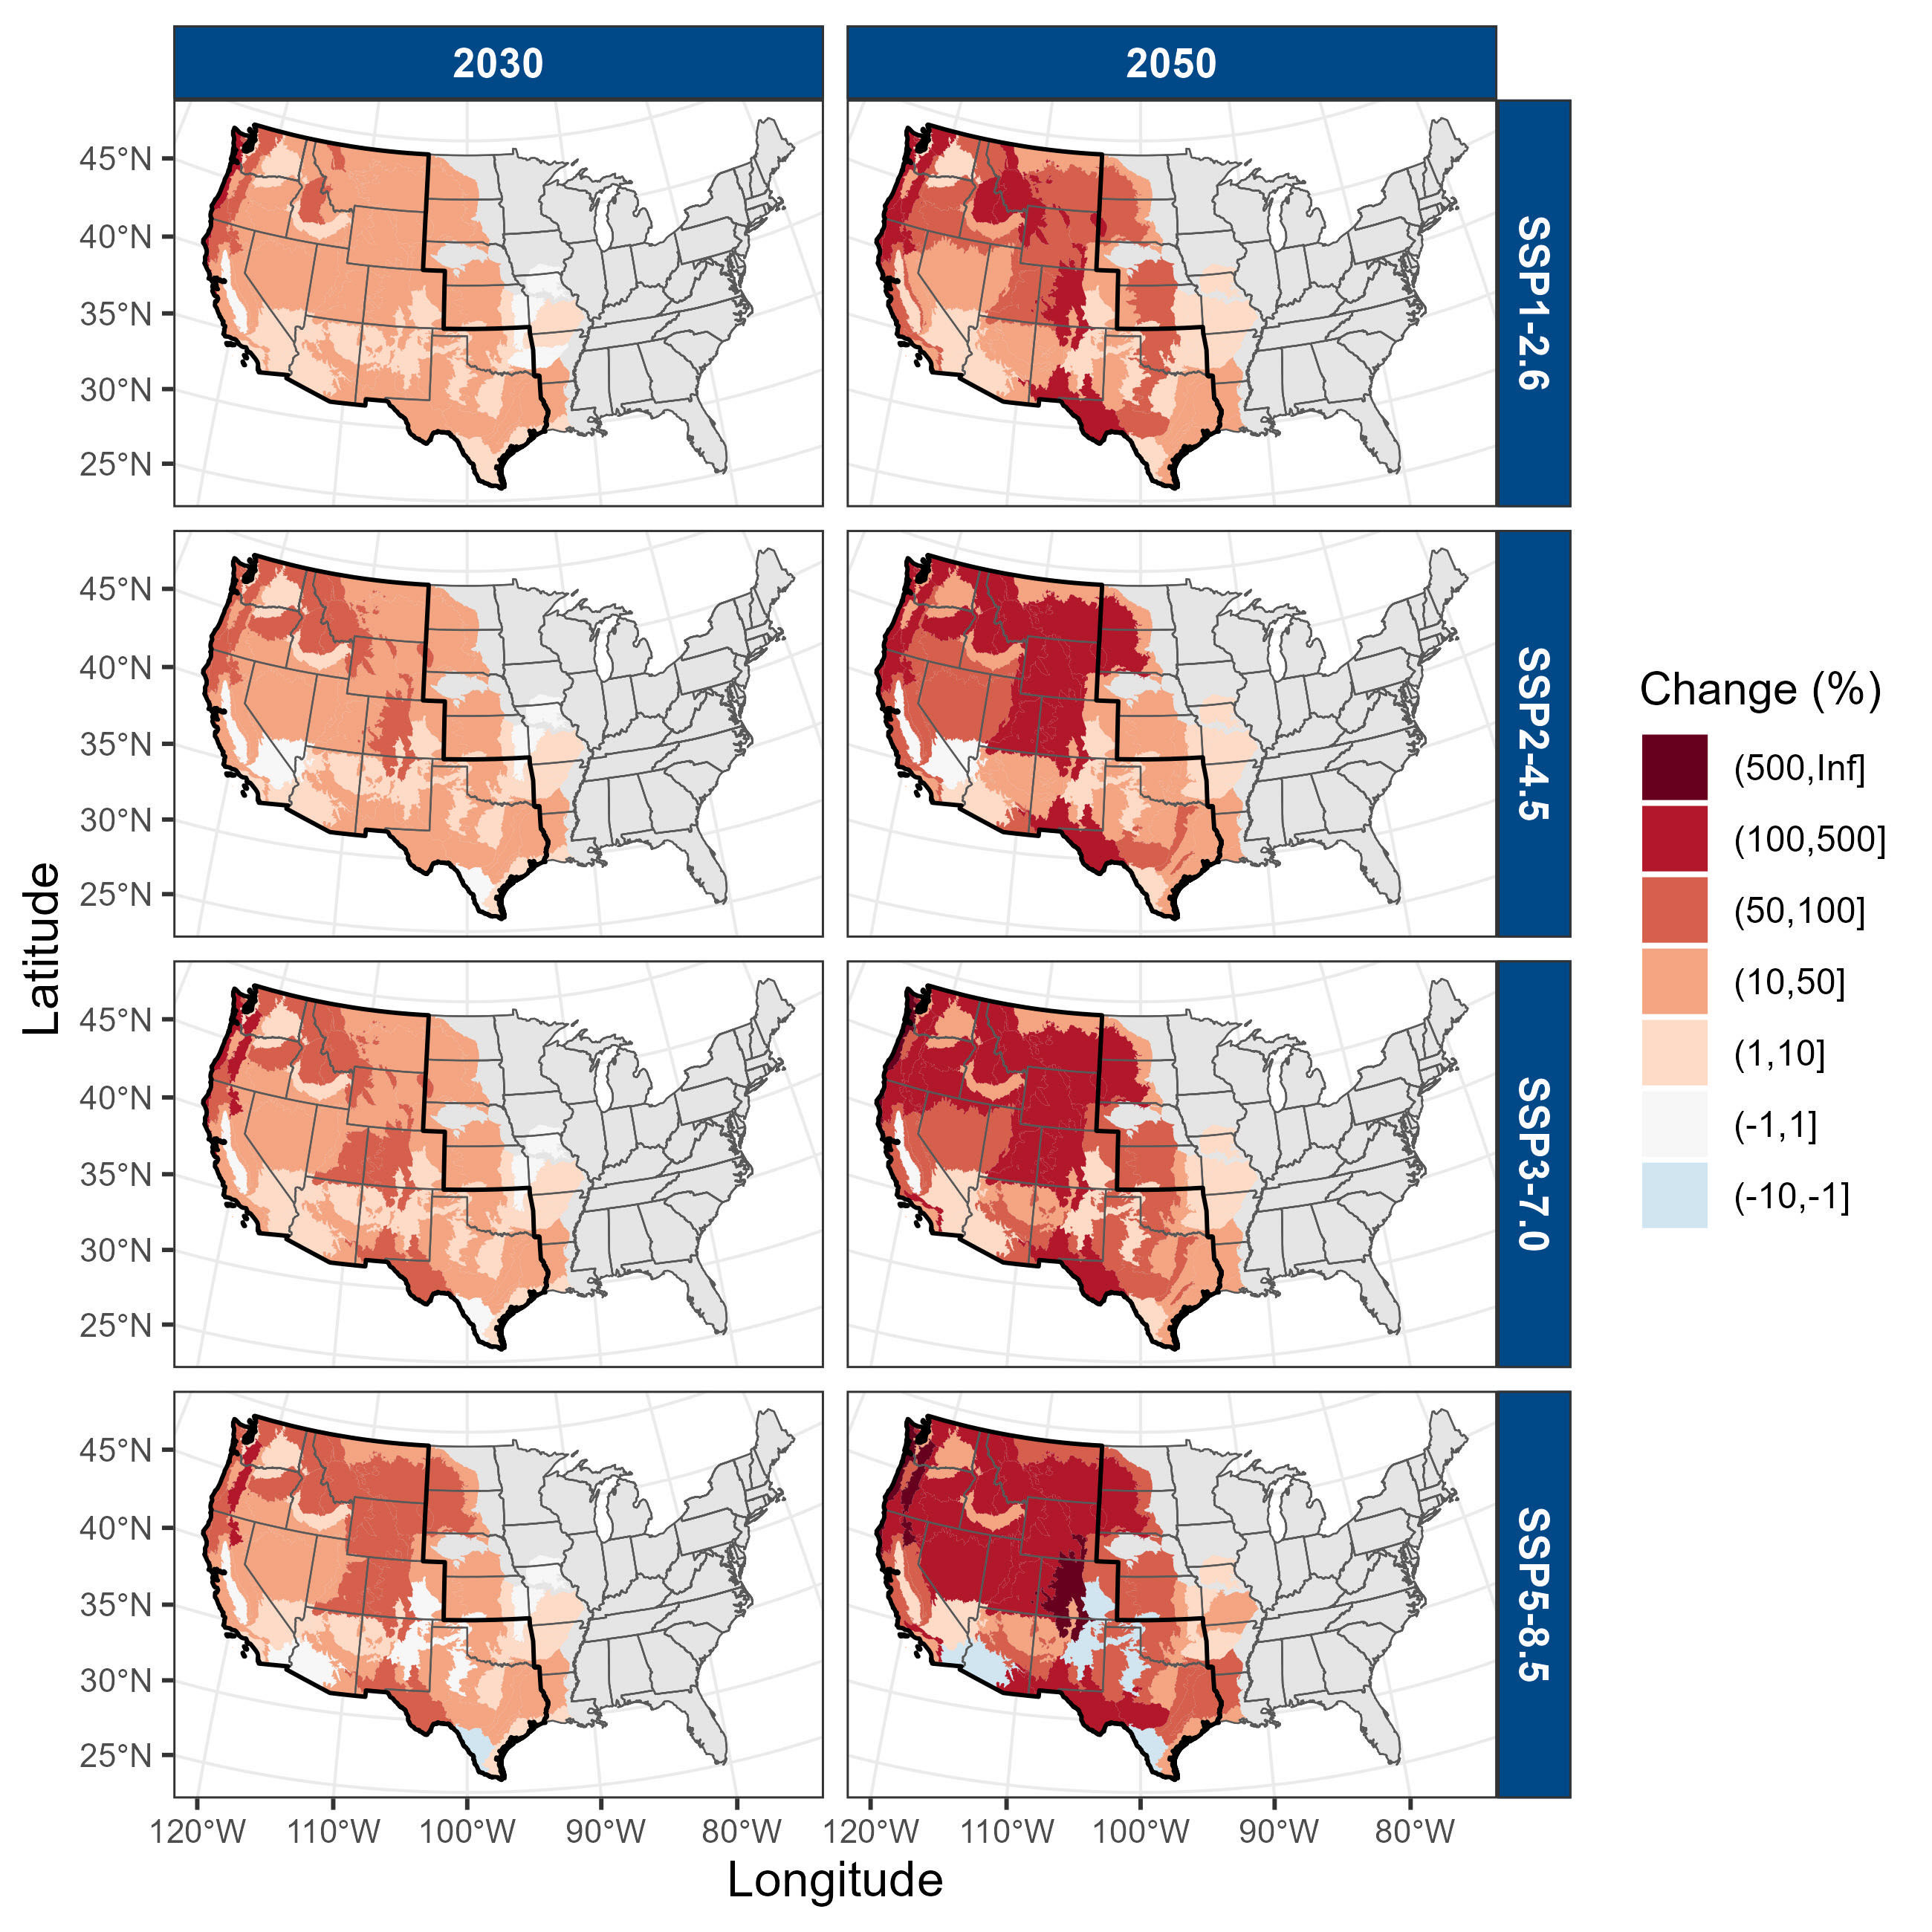
Projected change (%) in the average annual burn area by ecoregion under four SSP-RCP scenarios at 2030 and 2050 relative to 2018 based on the mean of six GCMs presents projected changes in average annual burn area by ecoregion for the four SSP-RCP scenarios and two time-horizons (2030 and 2050) based on the mean of the six GCMs. Changes for each individual GCM can be found in the Burn Area worksheet of the supplementary spreadsheet included in the Climate Change Projections release.
Given the broadly uniform VPD increases across the western U.S. (shown in Projected change (%) in the mean May-to-October VPD by ecoregion under four SSP-RCP scenarios at 2030, 2050, 2075, and 2100 relative to 2018 based on the mean of six GCMs), ecoregion-specific changes in average annual burned area depend strongly on the historical sensitivity of climate to wildfire risk in each ecoregion. Hence, the pattern of highest change in burn area in Projected change (%) in the average annual burn area by ecoregion under four SSP-RCP scenarios at 2030 and 2050 relative to 2018 based on the mean of six GCMs reflects the pattern of highest β in Climate-fire sensitivity based on the magnitude of the highest β regression parameter in the statistical model for each ecoregion of the Verisk Wildfire Model for the United States domain..
Projected change (%) in the average annual burn area by ecoregion under four SSP-RCP scenarios at 2030 and 2050 relative to 2018 based on the mean of six GCMs shows that under SSP2-4.5, by 2030 the largest increases of 50-100% are in the northwest in Washington, Montana, Oregon, Utah, and northern California, as well as the central east of the model domain in Colorado. These increases occur in the Southern Rockies (59%), Klamath Mountains (59%), Middle Rockies (61%), Coast Range (86%), Canadian Rockies (93%), and Cascades (100%). There is some variation across the scenarios at 2030, for example between SSP1-2.6 and SSP3-7.0, the increase in the Cascades is 85-115%. Across all scenarios at 2030 there is little to no change in the Central Californian Valley (ecoregion 7) and Mojave Basin (14). The Central Californian Valley is agricultural land and historical wildfires are not well explained by climate in this ecoregion. The Mojave Basin is desert in the facilitative regime and precipitation changes there are very small (0-1%).
These findings in average annual burned area changes shown in Projected change (%) in the average annual burn area by ecoregion under four SSP-RCP scenarios at 2030 and 2050 relative to 2018 based on the mean of six GCMs are supported by several previous studies (Spracklen et al, 2009; National Research Council, 2011; Kitzberger et al, 2017). Under a 1°C warming from the end of the 20th Century – roughly equivalent to a 50-year time period assuming 0.2°C warming per decade (NOAA, 2022) or SSP3-7.0 – the National Research Council projects that the average annual burned areas in the Southern and Middle Rockies will increase by 656% and 515% by 2050 relative to 2018 respectively, the Arizona/New Mexico Mountains in the Southwest and the Pacific Northwest (excluding the Willamette Valley) will increase by 470% and 428% respectively, and the lowest increases of about 70% are in the desert basins of Arizona and Nevada.Additionally, in a recent study conducted by Verisk researchers for the Society of Actuaries, Sousounis et al. (2021) found a similar geographical pattern of changes in burned area with VPD using a static model approach, with slightly less historical data, and an older vintage of GCMs. The similarity in results with different data and approach suggests the pattern is robust.


As shown in Projected change (%) in the average annual burn area by ecoregion under four SSP-RCP scenarios at 2030 and 2050 relative to 2018 based on the mean of six GCMs, by 2050, the differentiation in results across climate scenarios becomes more apparent. Consistent across all scenarios is that the highest increases are in the northwestern states, and Colorado and western Texas. However the magnitudes of those increases varies.
For example, under SSP2-4.5 the highest increase is in the Coast Range (ecoregion 1) which is projected to have 316% higher burn area by 2050 – equivalent to 4.4% year-on-year (YOY). Under SSP1-2.6 the projected increase is 331% but under SSP3-7.0 and SSP5-8.5 it is 1030% and 726% respectively. Note that the exact increases do not scale in proportion to the global warming levels which are 1.8, 2.0, 2.2 and 2.4°C respectively.
The Coast Range has responded sensitively to VPD increases in the last 20 years with three of the top four largest burn areas occurring in 2008, 2014 and 2020. The magnitude of these increases is also driven by two of the six GCMs namely CanESM5 and ACCESS-ESM1-5. These models give larger VPD increases of 15-20% than the other four GCMs (6-8%), and the strong exponential response to VPD results in burn area increases of 1000-2500% for these two GCMs compared to 190-270% for the other four. 84% of this ecoregion is forested, the highest in the model domain, and yet it currently has a relatively low burn fraction. Therefore, under SSP5-8.5, despite high increases in VPD, fire-fuel feedback only significantly limits the projections from 2070 in CanESM5 and ACCESS-ESM1-5 but does not significantly limit the other four GCM projections.
Climate change may not be the sole driver of recent wildfire activity in ecoregion 1. Between 1939 and 1951, a series of wildfires known as the Tillamook Burn burned approximately 300,000 acres in this ecoregion (Neiland, 1958), which is twice as large as the cumulative area burned between 2002 and 2020. However, several studies agree that burn area in ecoregion 1, or the Pacific Northwest region in general, is expected to increase significantly under climate change albeit those studies differ on the rate of increase for a particular climate scenario (Yu et al, 2013; Spracklen et al, 2009; Littell et al, 2010). The Pacific Northwest includes the Cascades (ecoregion 4), Puget Lowland (2), and Willamette Valley (3). In Verisk's Climate Change Projections, these ecoregions are projected to increase by 4.4% YOY, 0.4% YOY and 1.1% YOY respectively under SSP2-4.5.
Yue et al (2013) estimated changes under an SRES A1B scenario (equivalent to SSP4-6.0 i.e., slightly hotter than SSP2-4.5), of 1.5% YOY for the Pacific Northwest. Spracklen et al (2009) found 1.1% YOY changes for the Pacific Northwest region while Littell et al (2010) estimated 0.9-1.4% YOY changes for Washington . The latter two results were derived using regression models but the first result (Yue et al, 2013) used a parametric model. Projections from regression models are sensitive to the historical data used and will also depend on the resolution of the climate data used. Yue et al (2013) and Spracklen et al (2009) derive their climate projections using GCM outputs that have not been downscaled. Littell et al (2018) uses high-resolution (1/16 degree) downscaled data applied to Bailey’s ecoprovinces and for a region equivalent to ecoregion 1, projects a very small increase in burn area under A1B because their regression suggested this region is in a facilitative regime. However, they do not train their model on data beyond 2006 and therefore miss the three high burn years which occurred during higher-than-average VPD seasons.
Dynamic vegetation models – meaning models that attempt to simulate vegetation growth and wildfire burns explicitly – project that ecoregion 1 and the rest of Oregon state will experience significant repeated forest fires in the latter half of the 21st Century and substantial changes in vegetation (Dalton and Fleishman, 2021). For example, Rogers et al (2011) found a 1.0% to 2.6% YOY increase from three GCMs coupled with the MC1 model under an A2 scenario (equivalent to SSP5-8.5).
After ecoregions 1 and 4, the highest projections in this study are in the Canadian Rockies (ecoregion 41) and Southern Rockies (21). Under SSP2-4.5 and SSP5-8.5, the Southern Rockies is projected to increase by 284% and 584% respectively, equivalent to 3.6% and 6% YOY. A recent study on this ecoregion gives projections up to 2.4% YOY between 2000 and 2040 and up to 1.9% YOY between 2000 and 2080, both under RCP8.5, but it also gives the much lower 0.8% YOY using a different GCM (Henne and Hawbaker, 2023). That study fits a Gaussian regression model to wildfire frequency, but if a Poisson regression model had been used there would have been significantly higher projections in future frequency and consequently annual burned area.
It is important to consider the projections in California where most of the AAL occurs. The highest increases are expected in northern California which partially contains the Cascades (4) and Klamath Mountains (78) which have increases of 4.4% YOY and 2.5% YOY respectively under SSP2-4.5 out to 2050. At the same scenario and time-horizon, moderate increases are expected in parts of south, west, and east California, year-on-year increases of 1.7%, 1.3%, and 1.5% respectively. Little to no change is projected in the Central California Valley (ecoregion 7), and Mojave (14) and Sonoran basins (81) in the southwest. The National Research Council presented similar projections under a 1°C warming scenario from the end of the 20th Century which gave increases of 2.8% YOY in an aggregated northwest, north, and eastern region, 2.4% YOY in western California, and 1.1% YOY in southern California (National Research Council, 2011). Lower projections of 1% YOY in the north and 0.6% YOY in the south were found using coarser GCM output and larger aggregated ecoregions (Spracklen et al, 2009).
Texas is the third most contributing state to the industry AAL. There are 17 ecoregions partially or fully in Texas indicating a diverse range of vegetation, terrain, and ecology. The effect of climate change on wildfire risk in Texas is therefore also diverse. The largest increases are expected in the west in the Chihuahuan deserts (24) where 3% YOY increases are projected under SSP2-4.5. Moderate increases of 1.5% to 1.7% YOY are expected in central Texas around Austin, Dallas, and San Antonio. Increases of 1.2% YOY are in the north and east but there are negligible changes in the northeast and south.
The burned area projections can be aggregated using categories that are not geographical and compared to other studies that drew conclusions about future projections for those categories. Categorizing by fire-climate regime, it is found that the effect of climate change on a particular ecoregion is sensitive to the regime that ecoregion belongs to. For example, the highest increase in burn area, 2.2% YOY under SSP2-4.5, is projected for ecoregions in the direct (aridity-limited) regime while little to no change is expected for those in the facilitative (fine fuel limited) regime. Ecoregions in the mixture regime are expected to experience moderate increases of 1.8% YOY under SSP2-4.5. The direct and mixture regimes can be compared to the flammability limited and flammability-fuel limited regimes respectively in Littell et al (2018) where, under a slightly warmer than SSP2-4.5 scenario, similar increases of 2.4% YOY and 1.9% YOY were projected.
Another way to categorize the ecoregions is into predominantly forested (greater than 50% forest coverage) and non-forested (less than 50%). Ecoregions with more forest tend to correlate with higher burn area projections. For example, under SSP2-4.5 2050, the Pearson correlation between forest coverage and relative change in burn area is 0.4 suggesting a correlation of moderate strength. For ecoregions with greater than 50% forest coverage an increase of 3% YOY under SSP2-4.5 out to 2050 is projected, whereas for ecoregions with less than 50% forest coverage, a more modest increase of 1.6% YOY is projected for the same scenario and time-horizon. For the same scenario (SSP2-4.5), Abatzoglou et al (2021) found that the forested domain of the western U.S. would increase by 2.5% YOY when no feedback is accounted for. With moderate feedback (τ = 30 years and γ = 1.0), the increase was 1.6% to 1.9% YOY which is lower than projected here. But note the Verisk projections were created using τ = 15 years which allows for faster regrowth, and in addition to fire-fuel feedback, Abatzoglou et al (2021) included post-fire regeneration failure where reforestation is limited by high soil moisture deficits in years of high aridity.
