Future loss projections
Projections in occurrence and aggregate average annual losses and loss exceedance probabilities are presented for the four SSP-RCP scenarios at the 2030 and 2050 time-horizons. These loss projections were derived by mapping each scenario-horizon’s representative catalog to the Verisk industry 10,000-year Year Event Loss Table (YELT). The exposure and vulnerability of that exposure reflects the present-day for all projections. Projections are presented at the industry portfolio (Verisk industry exposure data across the model domain), state, and county levels with a focus on the SSP2-4.5 and SSP5-8.5 scenarios at 2030 and 2050.
Portfolio
Projected change (%) in the portfolio average annual loss (AAL) and aggregate annual loss exceeded at select return periods (years) based on the Verisk industry 10,000-year catalog for four SSP-RCP scenarios at time-horizons 2030 and 2050. presents the change in the portfolio AAL and aggregate losses exceeded at the 2- to 500-year return periods for each scenario. The exact numbers, including the 1000-year loss and equivalent occurrence losses, are in Percent (%) change in average annual loss (AAL), annual occurrence loss (AOL) and aggregate and occurrence loss exceeded for return periods 2- to 1000-year to the Verisk industry exposure database for each scenario and time-horizon based on the U.S. Wildfire 10,000-year catalog. in the Appendix and can also be found in the Portfolio Loss worksheet of the supplementary spreadsheet.
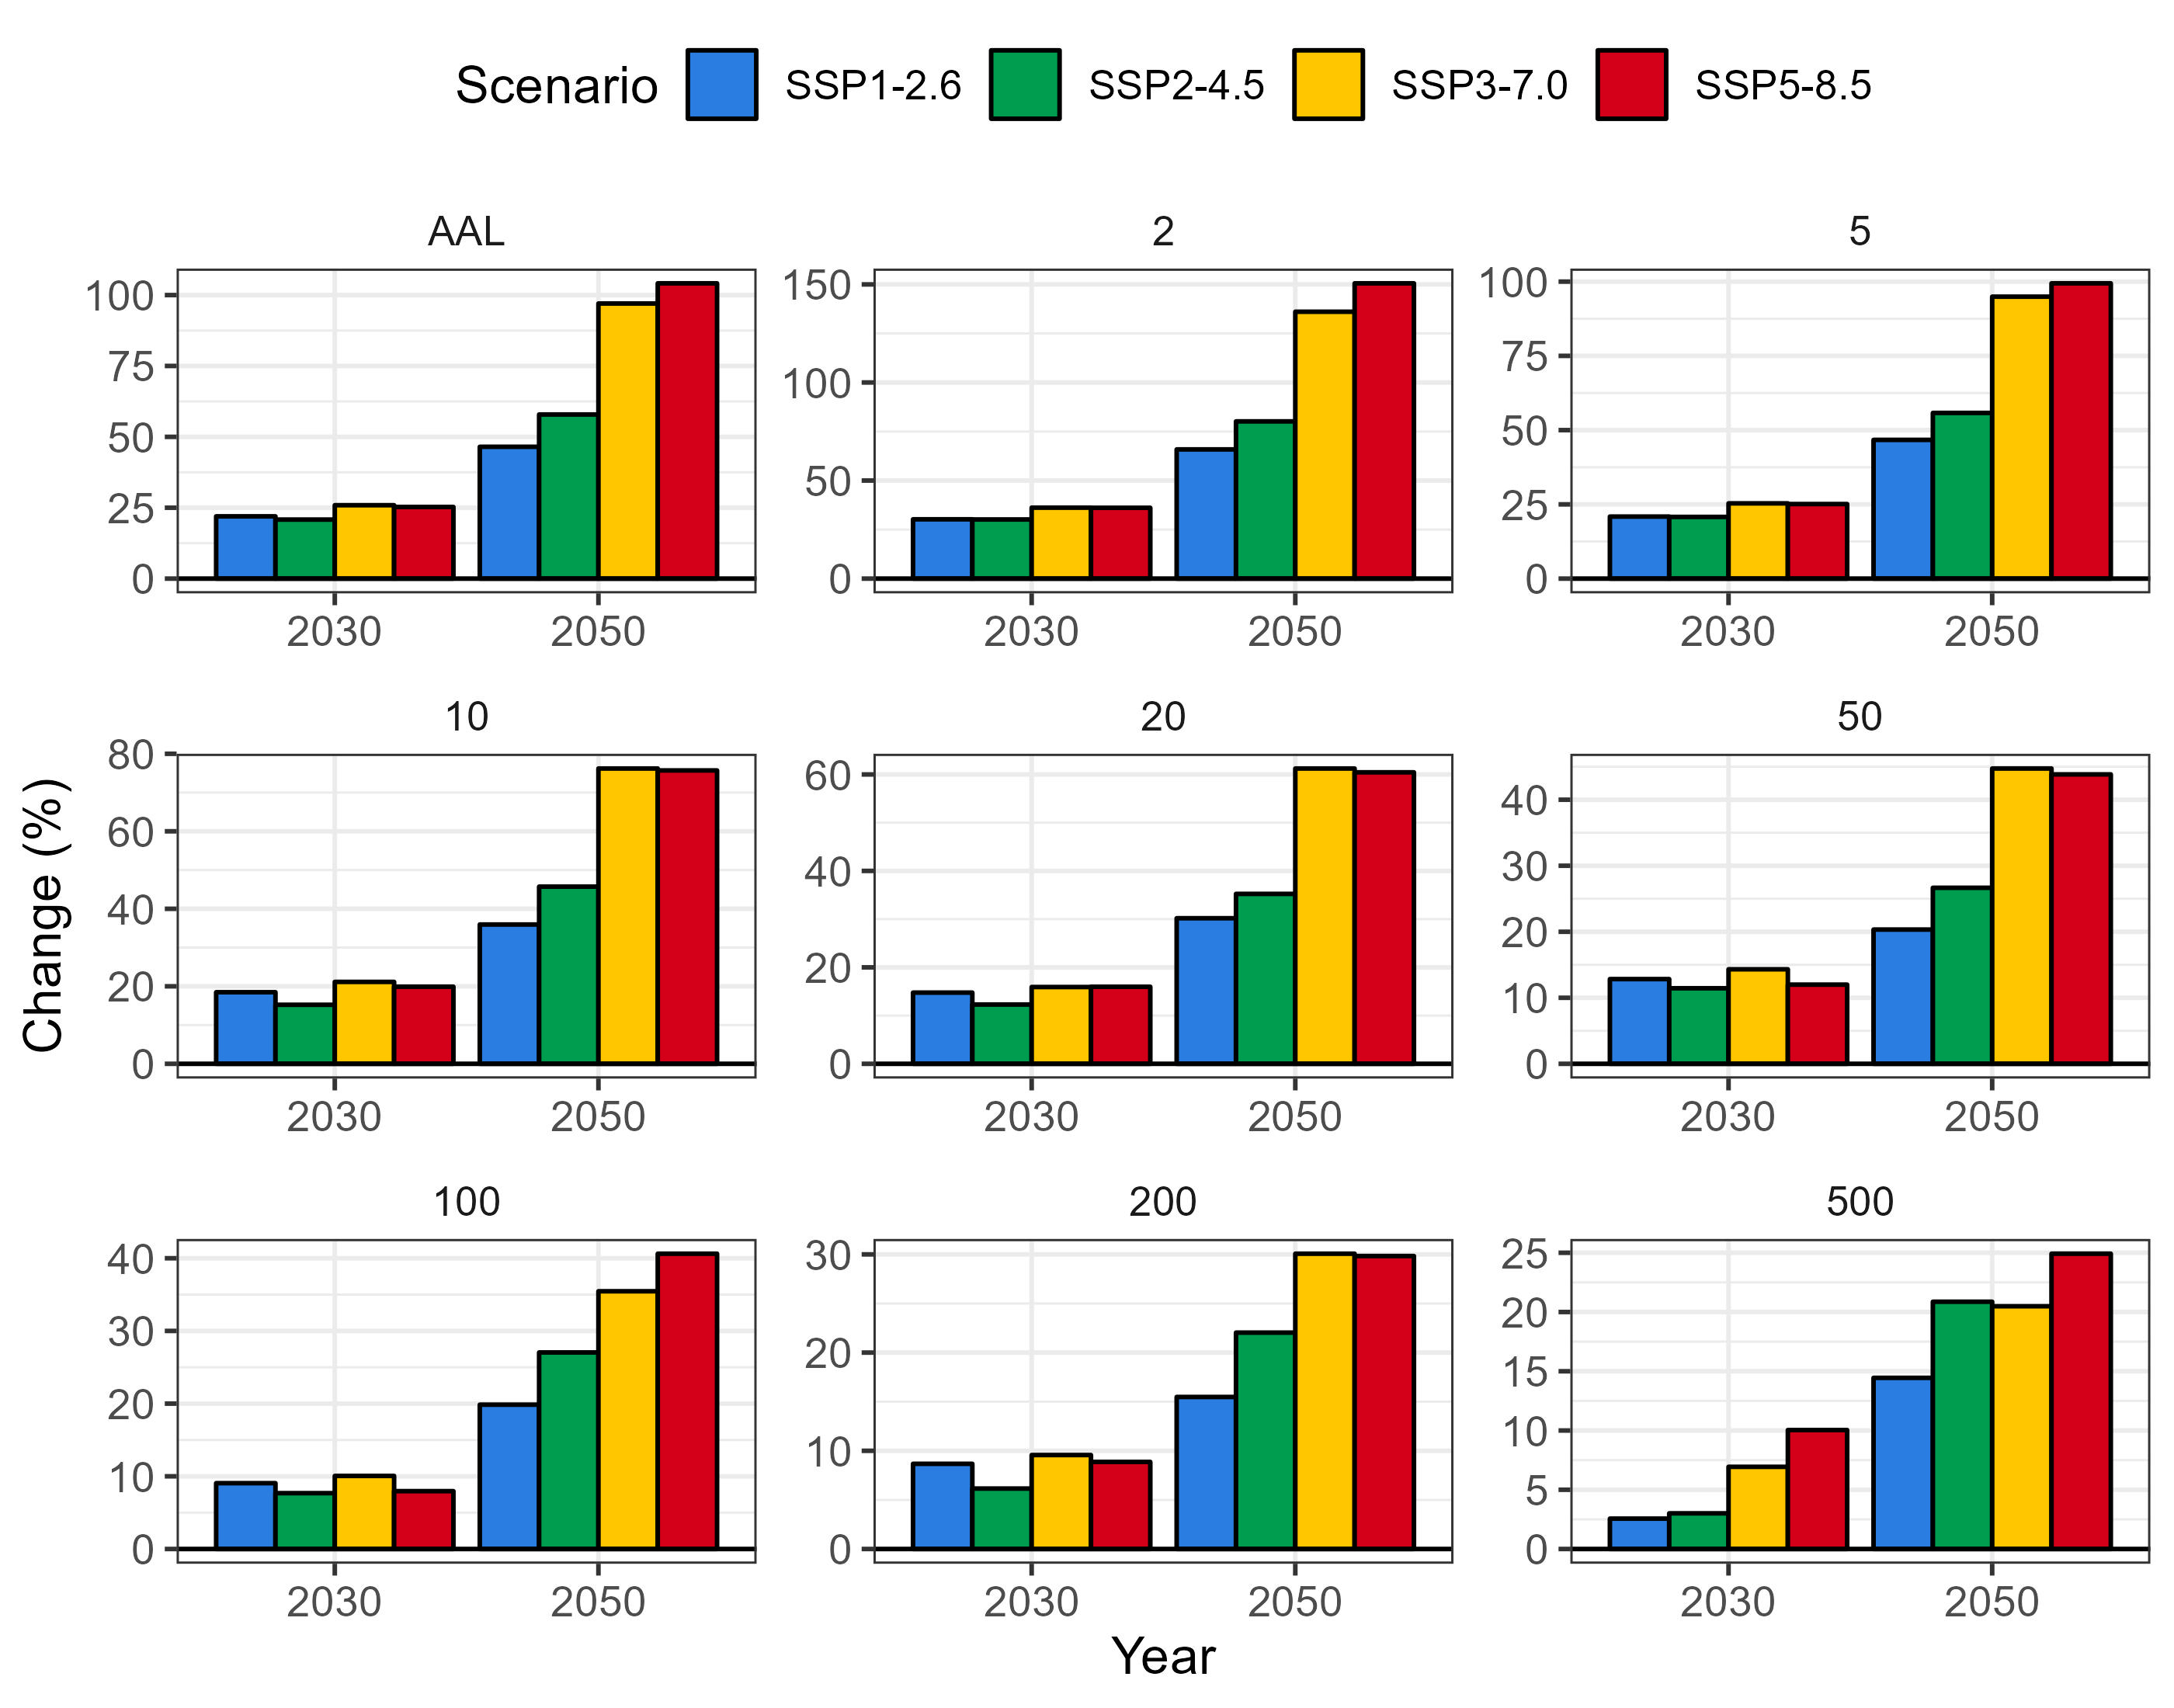
At 2030, there is little differentiation across the four SSPs in the AAL and all return periods up to the 500-year. For all SSPs the AAL and 100-year loss are projected to increase by about 25% and 8% respectively relative to 2018. At 2050, there is greater differentiation, the AAL and 100-year vary from about 50% to 100% and 20% to 40% respectively. The variation is in-line with the global warming levels for these four SSPs, with SSP1-2.6 being the lowest and SSP5-8.5 the highest. There is little difference between the projections for SSP3-7.0 and SS5-8.5 at 2050, and for some return periods (e.g. 10, 20, 50 and 100-year) SSP3-7.0 is higher. At the lower return periods, this is due to higher burned area projections for SSP3-7.0 than SSP5-8.5 in certain ecoregions but at higher return periods the effect is due to the stochasticity of sampled events. This is particularly notable in the occurrence loss changes.
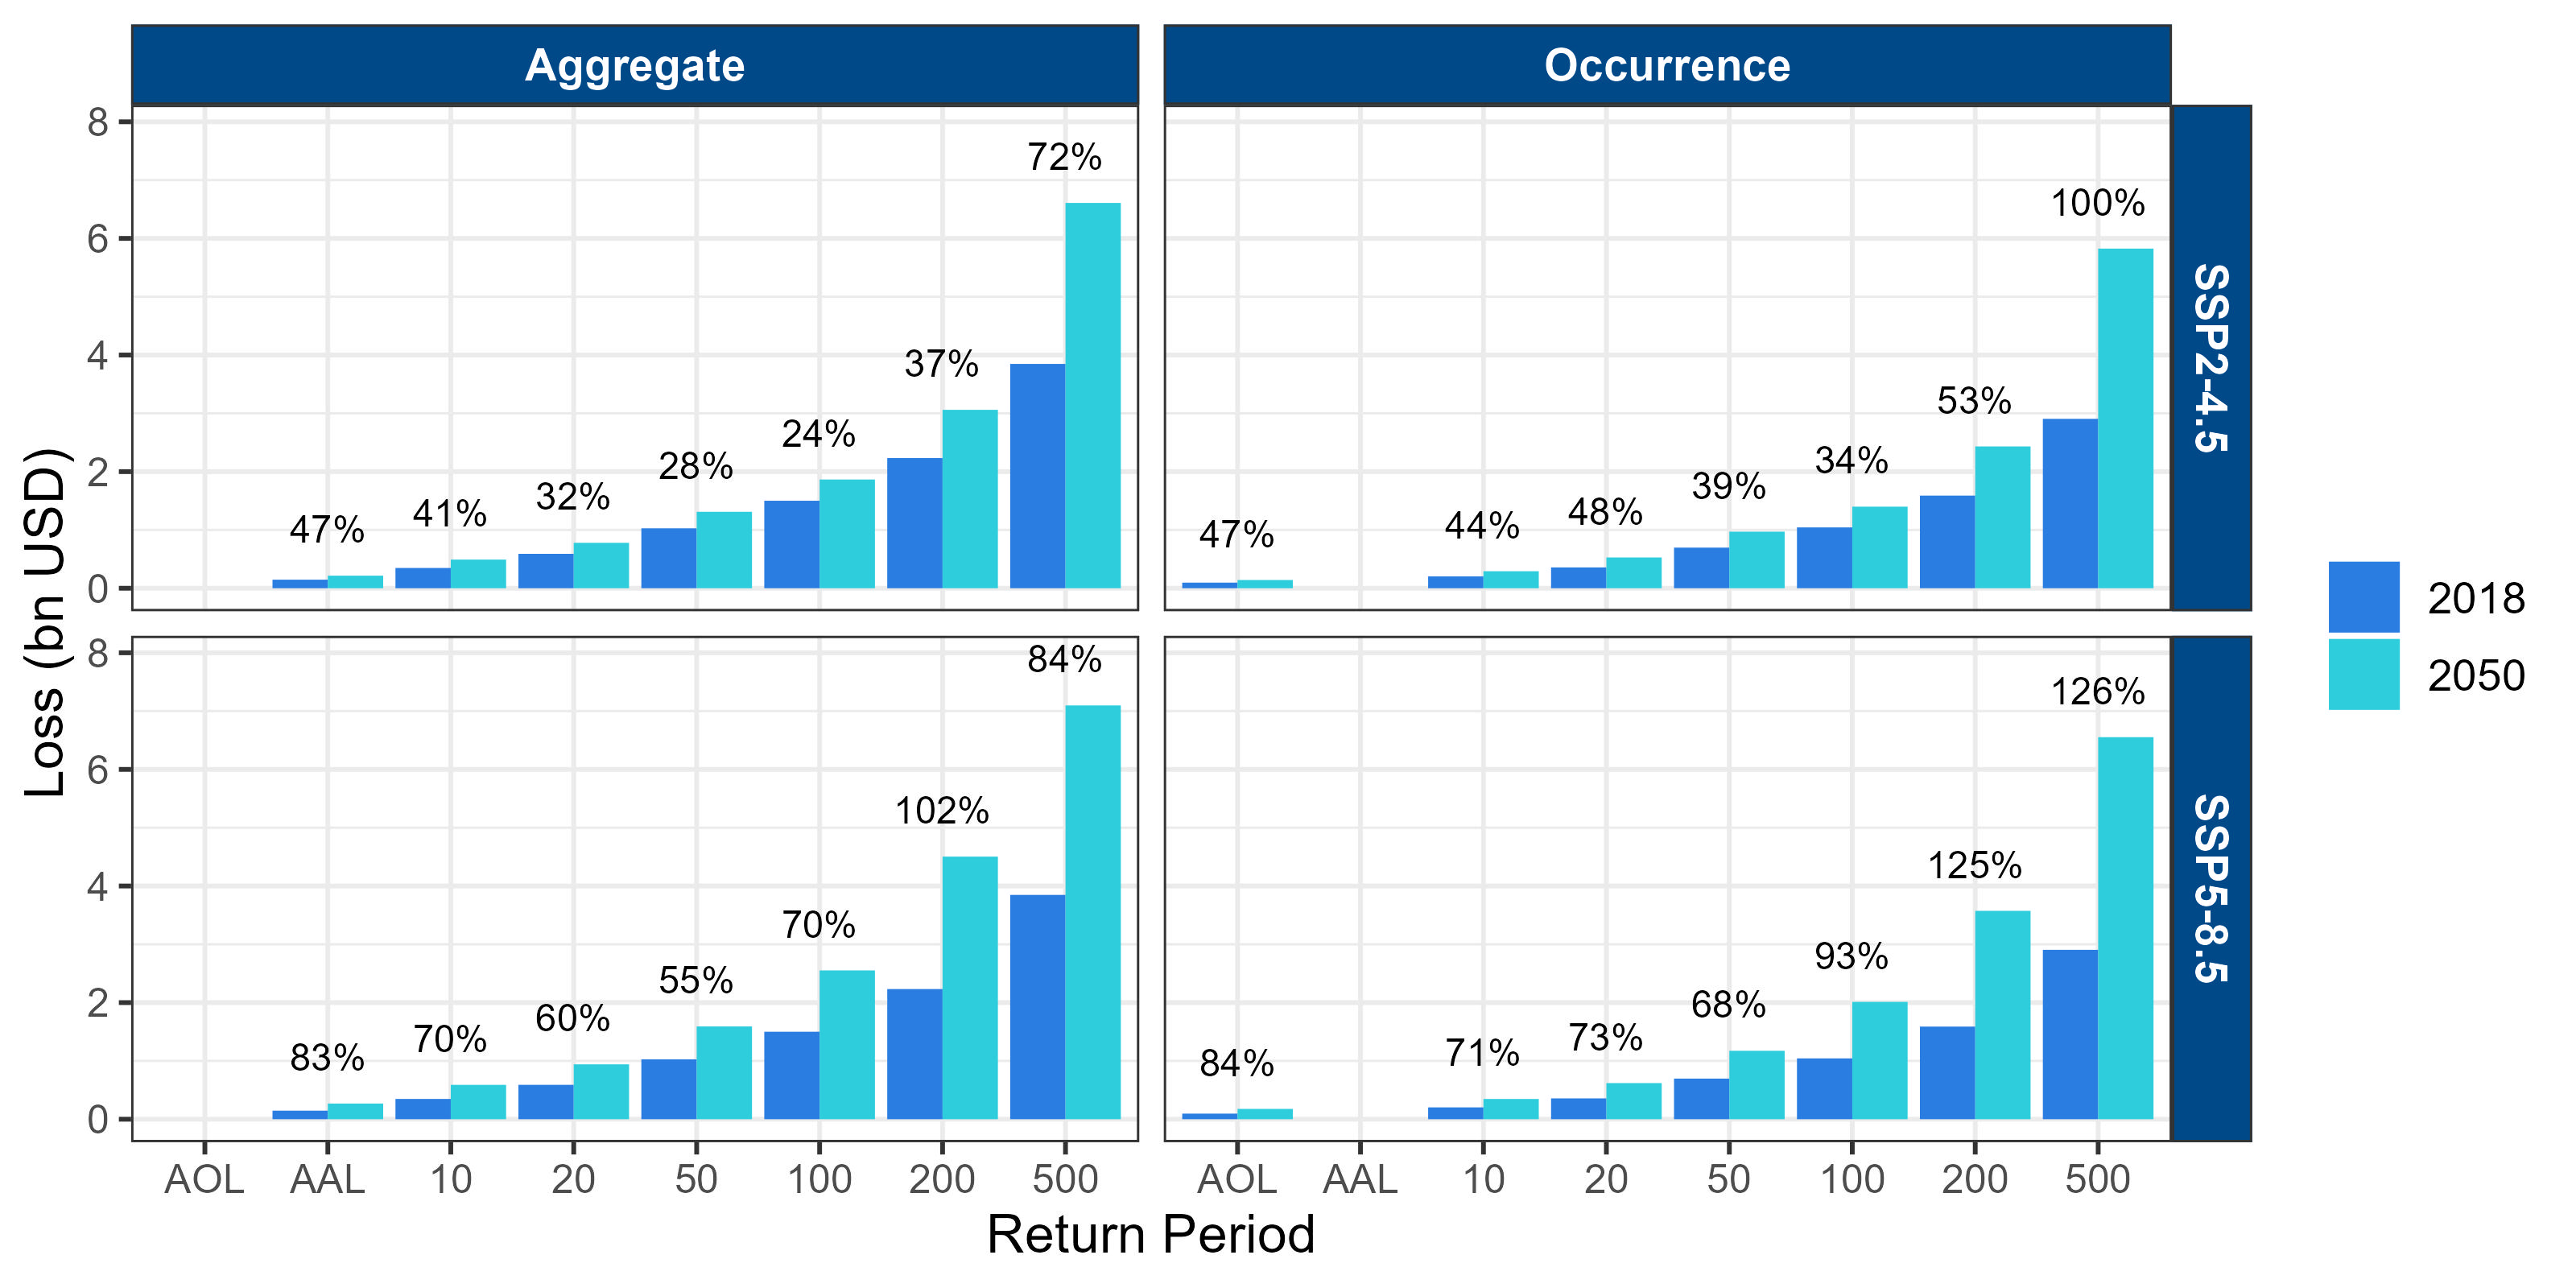
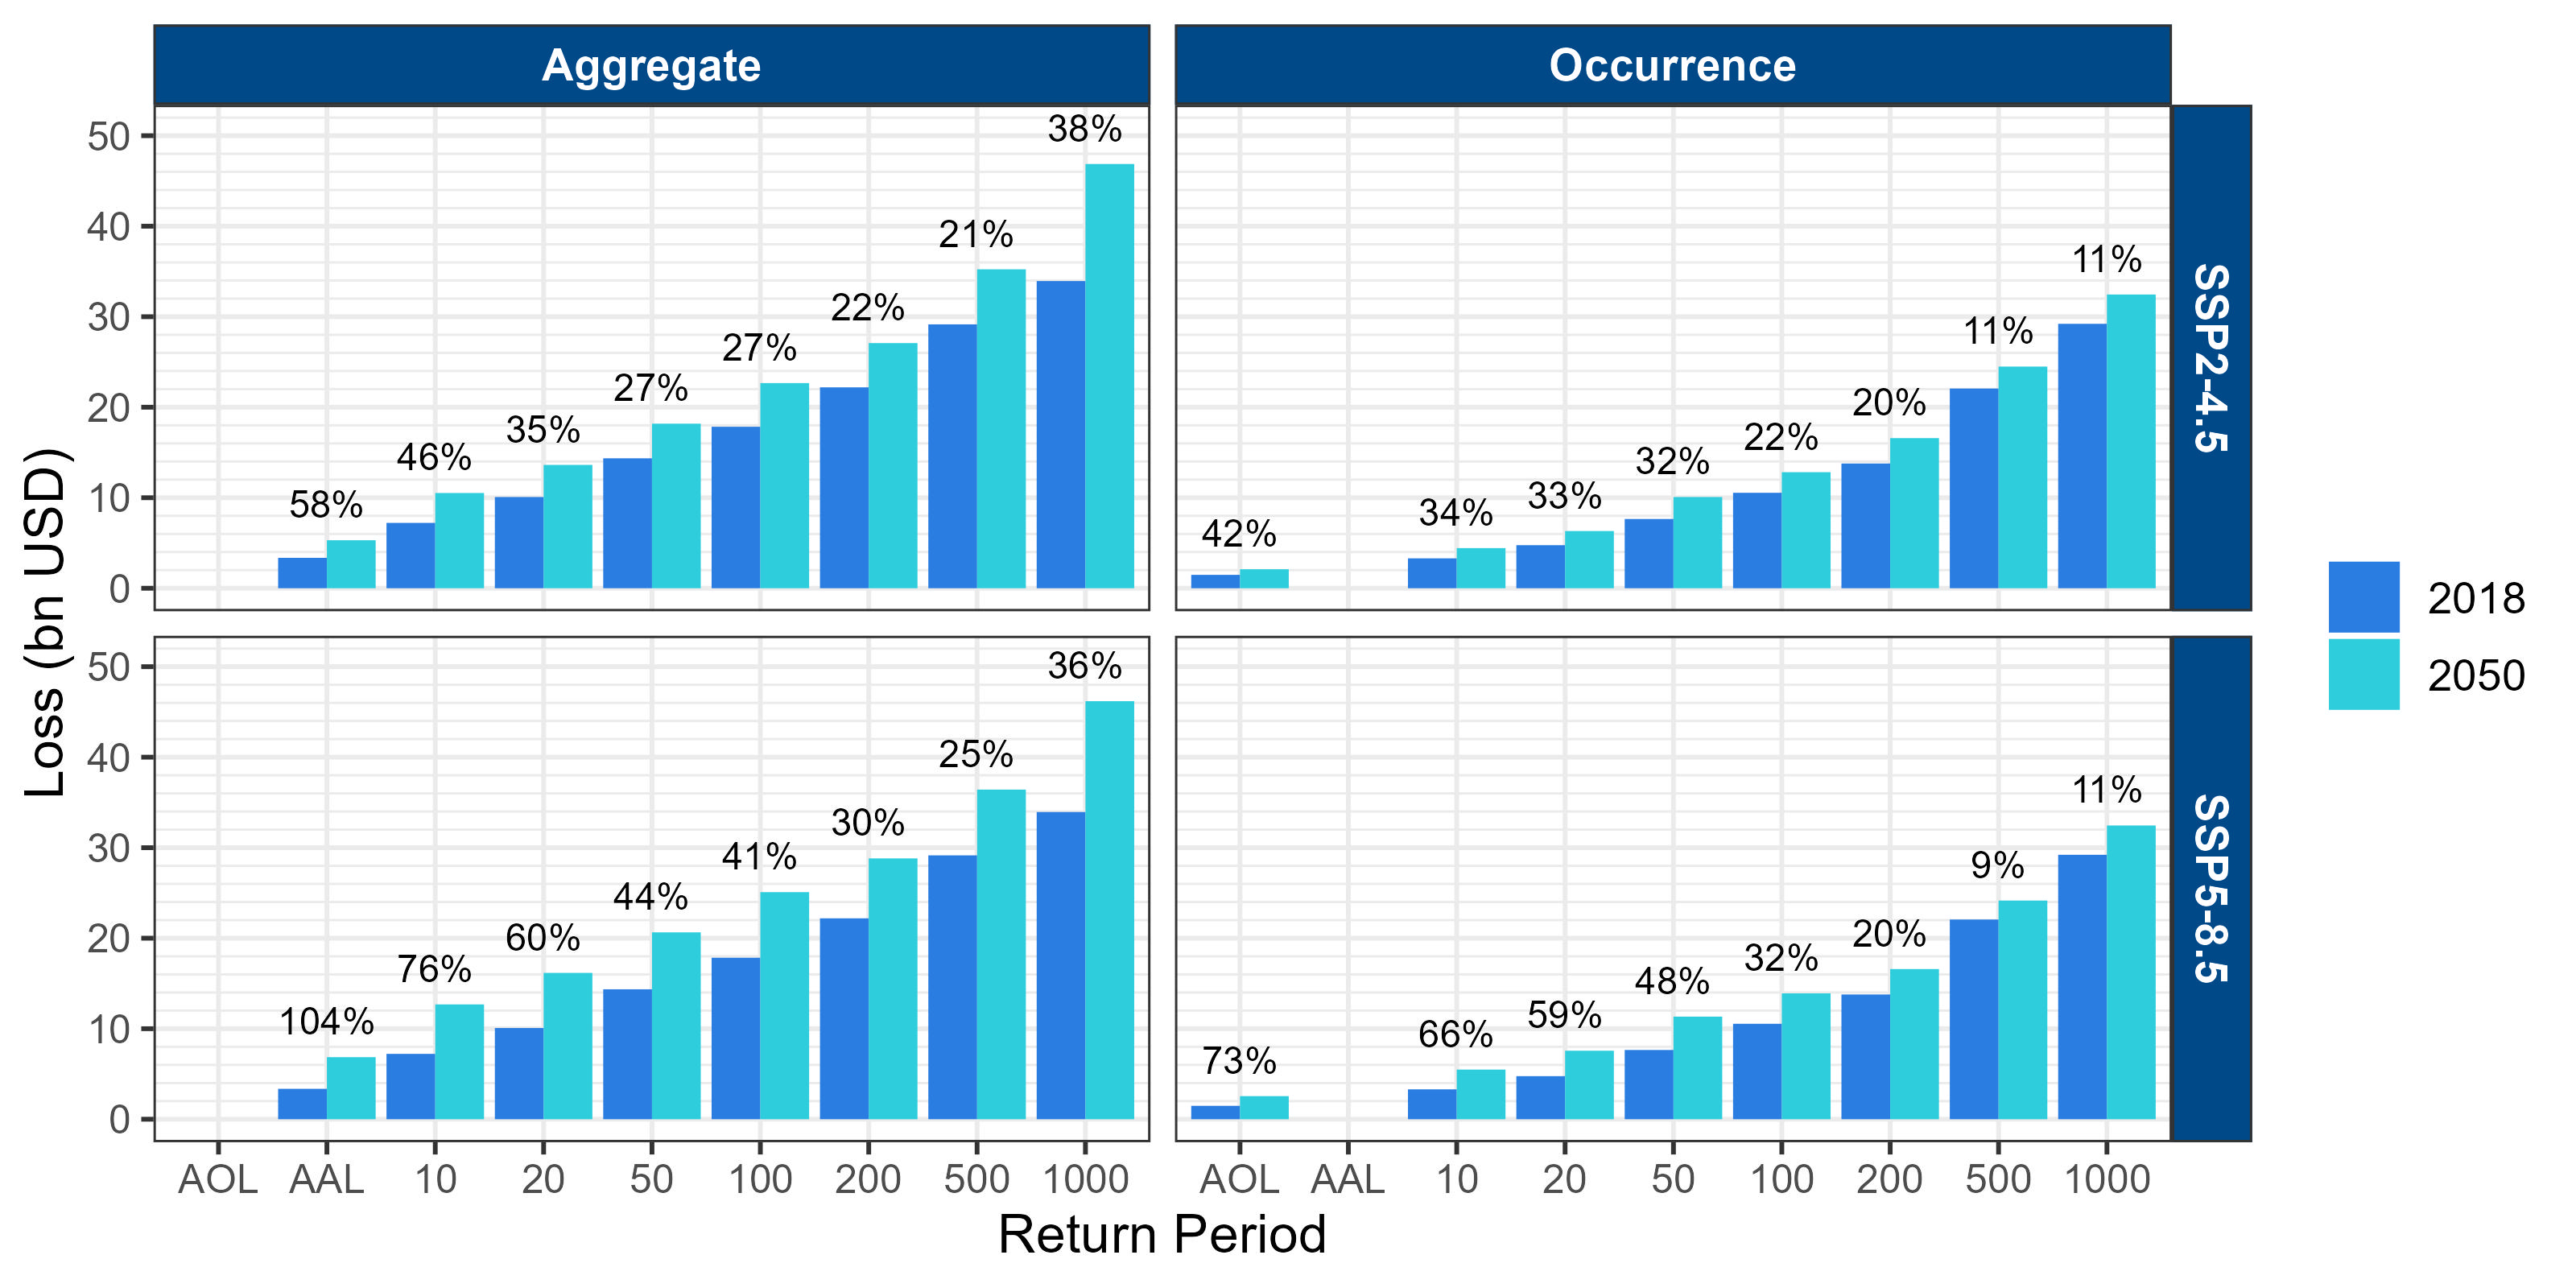
Absolute losses for the aggregate and occurrence portfolio average annual losses and losses exceeded at select return periods (years) based on the Verisk industry 10,000-year catalog for SSP2-4.5 and SSP5-8.5 at 2050. Changes (%) at 2050 relative to 2018 are written above each return period shows how the loss projections at 2050 for SSP2-4.5 and SSP5-8.5 compare to the present-day (2018) losses from an absolute perspective (with relative changes in text). The projections in occurrence loss tend to be lower than those in the aggregate which is a consequence of the hazard metric used to reflect future wildfire risk. The future fire projections are generally higher aggregate annual burned areas which suggests future years of higher event frequency and events with larger burned areas, but it could also suggest future years of many events with relatively low burned areas which could lessen the increase in the occurrence losses.
State
Portfolio loss changes are driven by loss changes in California since in the present-day this state contributes around two-thirds to the portfolio AAL. An additional fifth of the AAL is contributed by four other states: Arizona, Texas, Washington, and Colorado.
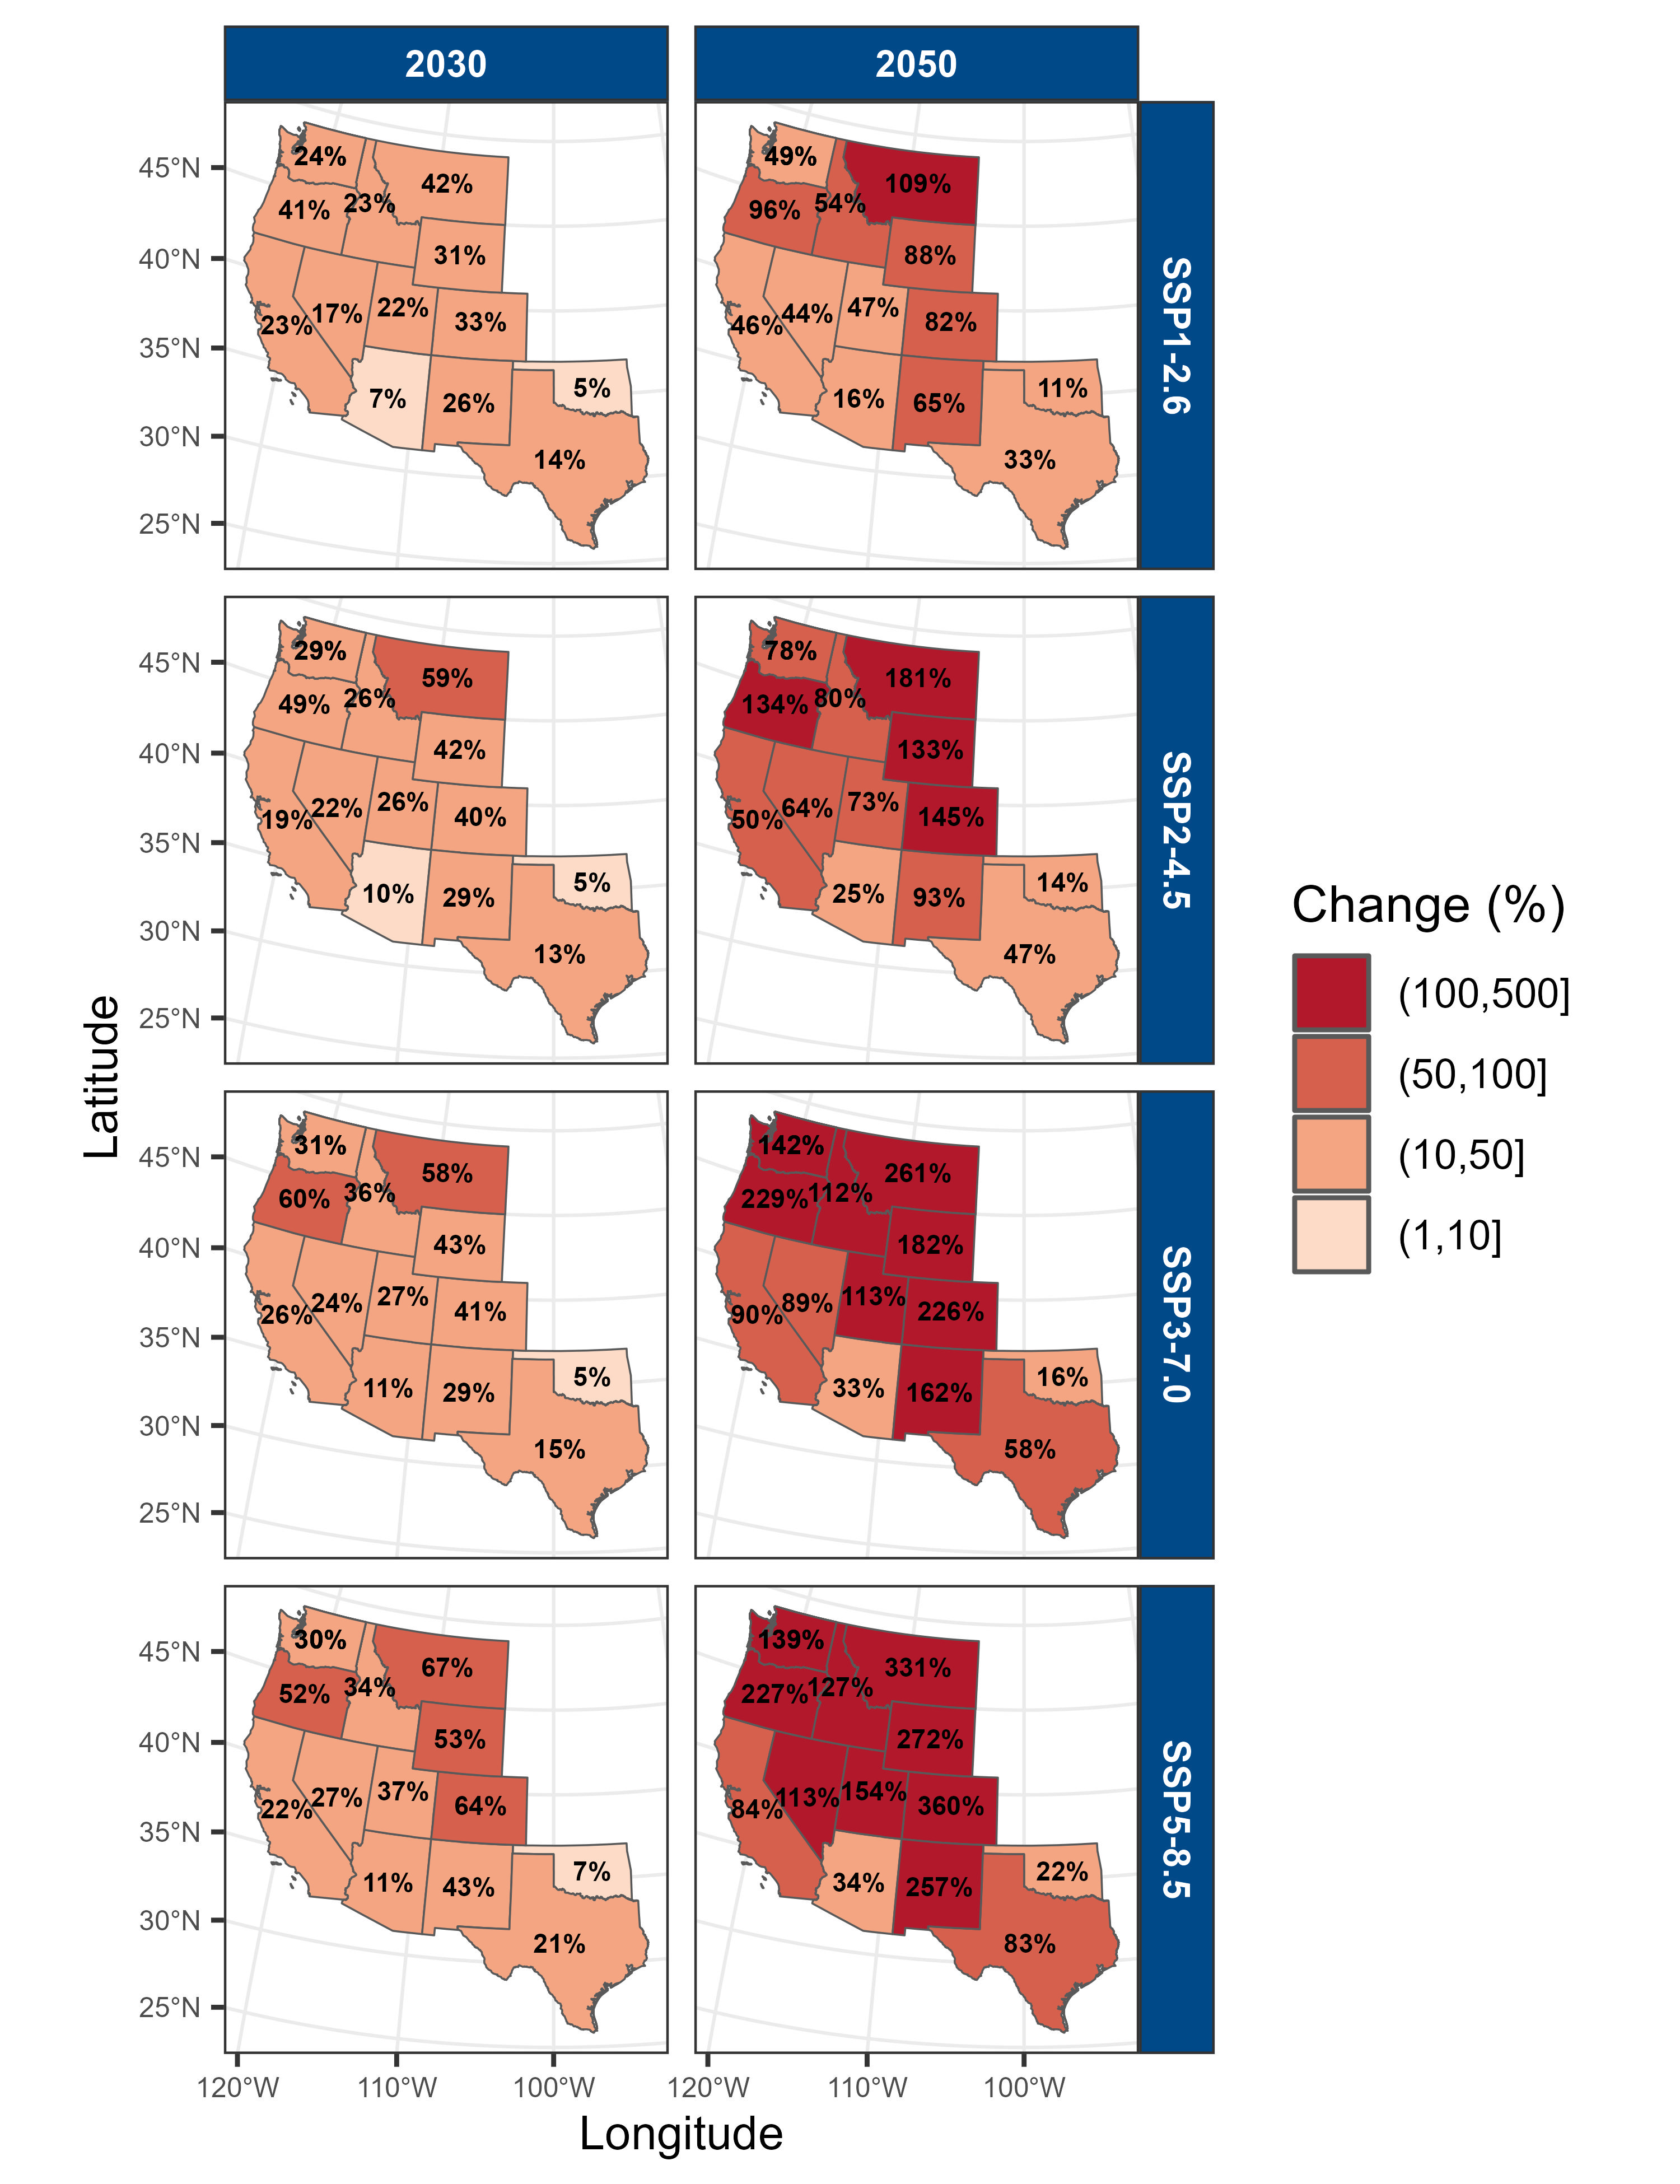
Projected change (%) in the average annual loss for each state under four SSP-RCP scenarios at time-horizons 2030 and 2050. Exact values written in text presents the changes in AAL for each state in the model domain for the four scenarios. The exact numbers are also in Percent (%) change in average annual loss (AAL) by U.S. state from the Verisk industry exposure database for each scenario and time-horizon based on the U.S. Wildfire 10,000-year catalog. of the Appendix and the State AAL worksheet in the supplementary spreadsheet. The highest AAL projected increases tend to be in Montana, Oregon, Wyoming, and Colorado; the lowest in Arizona, Oklahoma, and Texas. The exact order of which state gives the highest projections varies by scenario and, of course, by exposure. For example, at 2030, Colorado has the four highest projection under SSP2-4.5, but the second highest under SSP5-8.5. The projections in Montana are driven by the increases in burn area in the Canadian Rockies (ecoregion 41) and Middle Rockies (7). The projections for California are very similar to those observed at the portfolio level. For example, at SSP2-4.5, the California AAL is projected to increase by 20% and 50% at 2030 and 2050 respectively; changes that are roughly the same as those at the portfolio level.
County
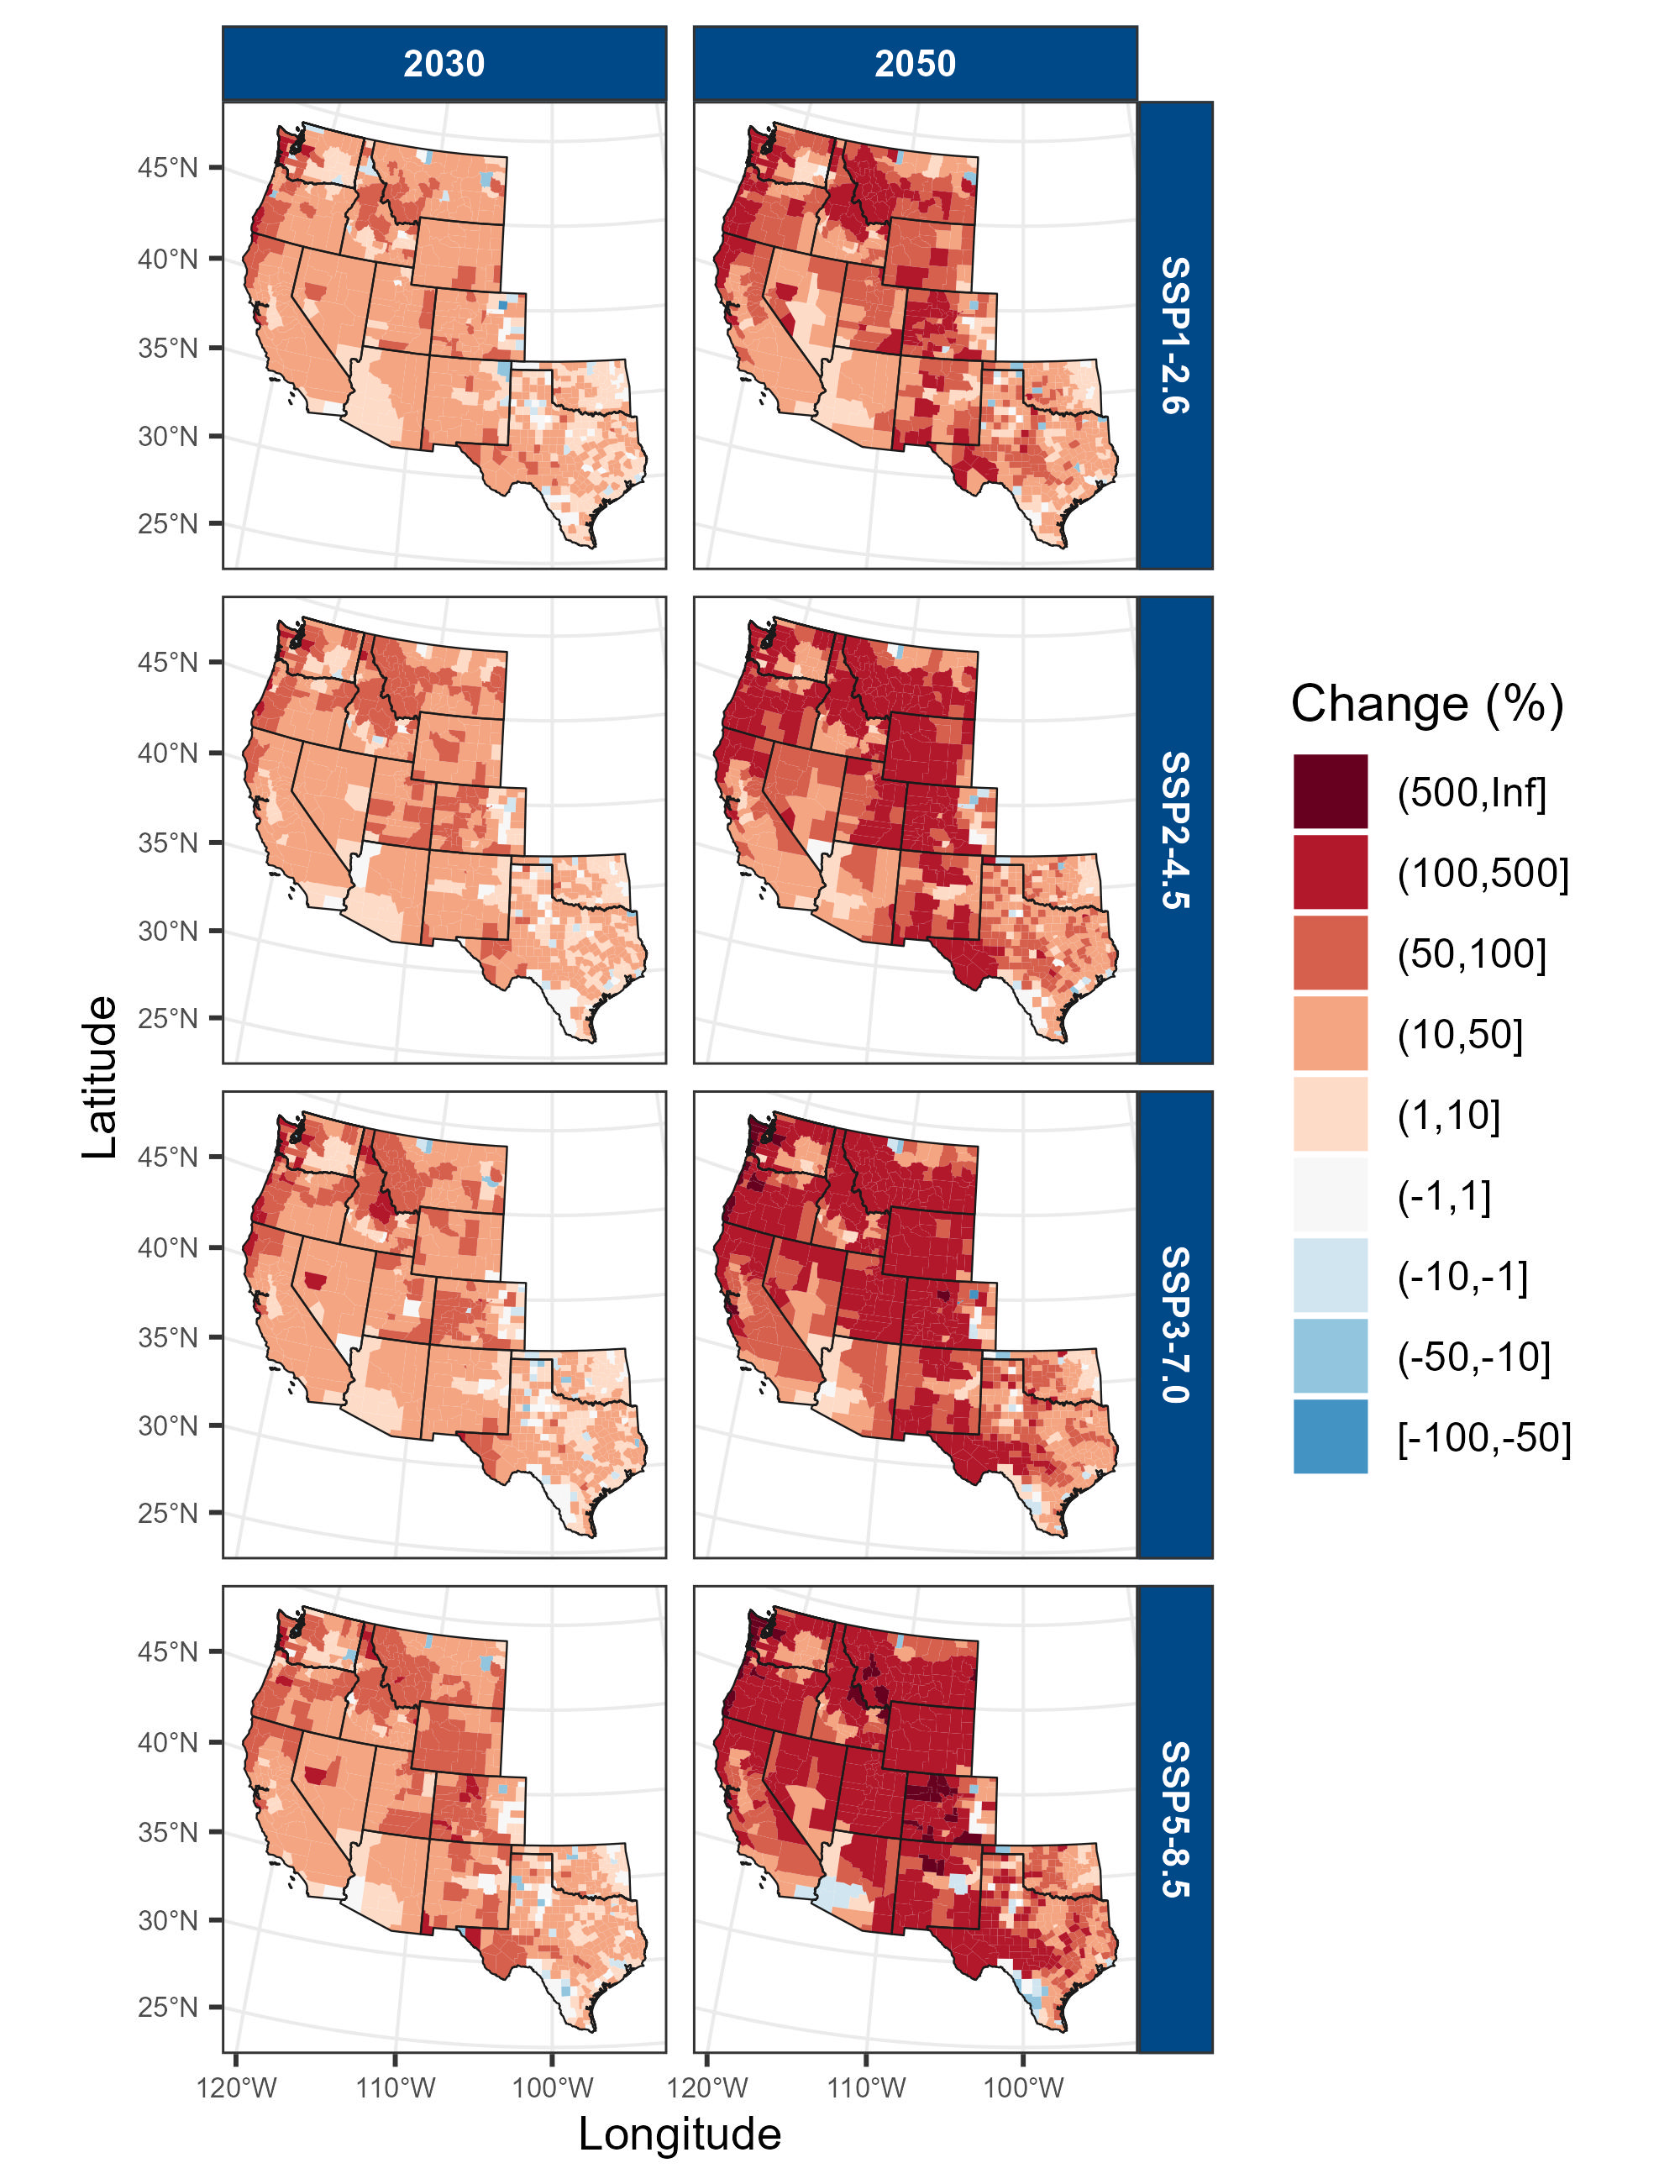
Changes at the county level are driven by increases in average annual burned area in areas of high exposure. Projected change (%) in the average annual loss for each county under four SSP-RCP scenarios at time-horizons 2030 and 2050 presents the changes in AAL for each county in the model domain for the four scenarios. The pattern of change broadly reflects the pattern of change in the average annual burned area projections shown in Projected change (%) in the average annual burn area by ecoregion under four SSP-RCP scenarios at 2030 and 2050 relative to 2018 based on the mean of six GCMs. For example, ecoregions such as the Sonoran Basin (81) and the Southern Texas Plains (31) that are projected to experience reduced wildfire risk in SSP5-8.5 at 2050,due to less precipitation, result in lower AALs in southwest Arizona and southern Texas for this climate scenario and time horizon.
For some counties, the AAL is projected to change by as much as -100% to -50% despite being in ecoregions with increased burn area; for example, northeast Colorado for SSP3-7.0 at 2050. These counties typically have little exposure and are affected by few events in the 10,000-year catalog, so the changes are not a reflection of climate change, but a consequence of the sampling algorithm replacing the few years in the catalog that caused loss there.
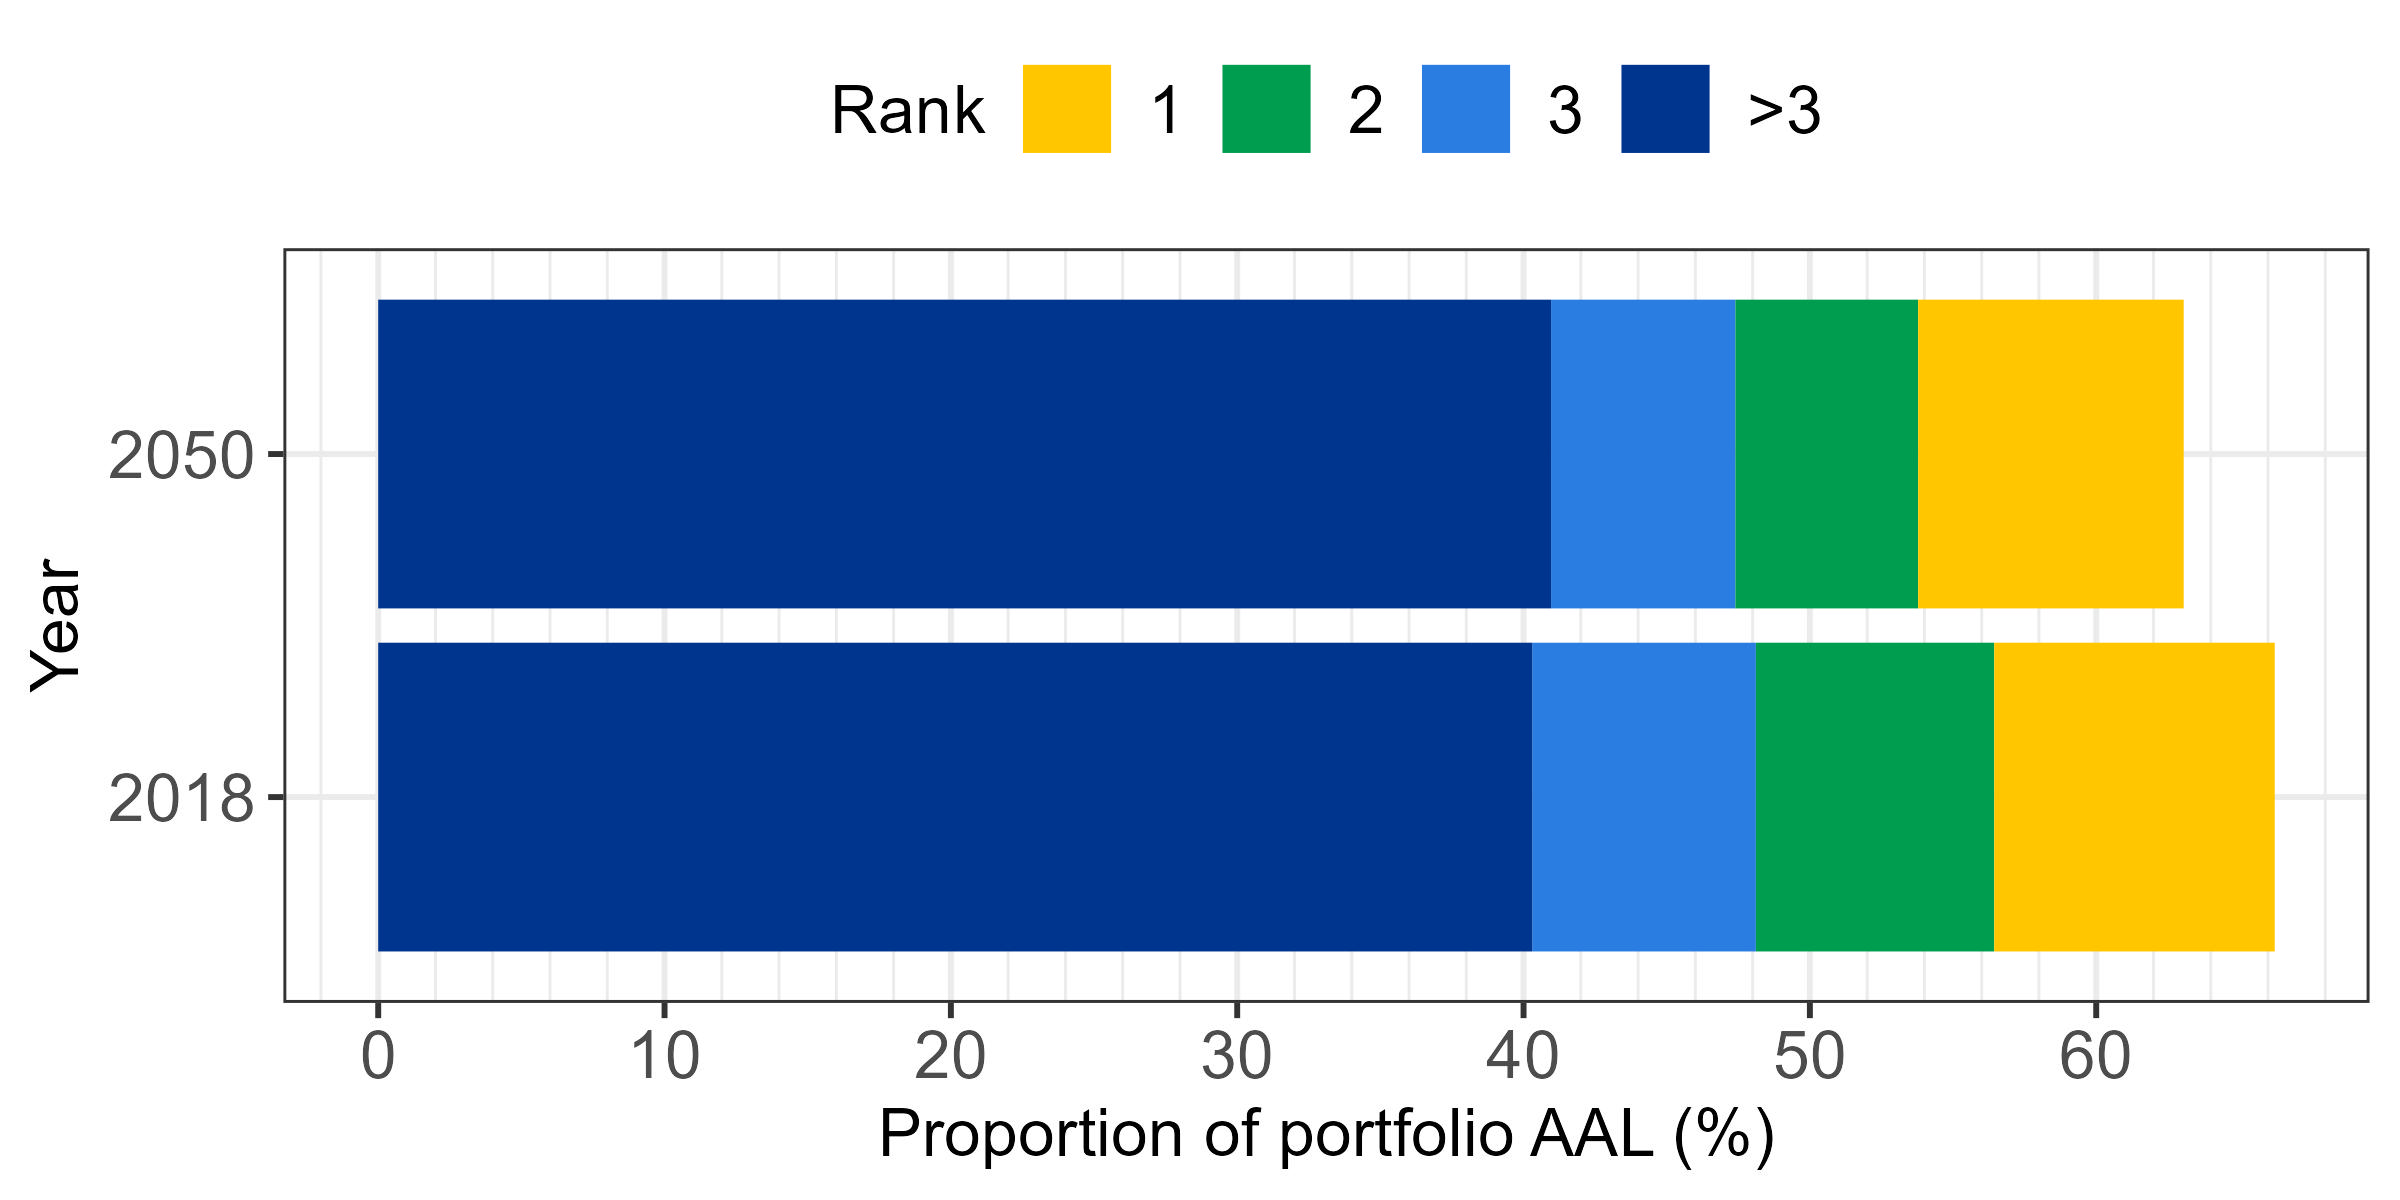
The effect of county level changes on state and portfolio levels can be summarized by considering how the contribution from the top counties in each state and the contributions of the states are altered by a particular scenario-horizon. California's proportion of portfolio AAL (%) in 2018 and 2050 under SSP2-4.5 and the proportion of its top three contributing counties (yellow, green, light blue) and remaining counties combined (dark blue) presents the contribution of California and its counties to the industry AAL in 2018 and 2050 for SSP2-4.5. Even though the AAL in California increases by 50% at 2050 its contribution to the portfolio AAL is reduced by several percent. The top three contributing counties in California based on 2018 losses are San Bernadino, Riverside, and Los Angeles. Their AALs are projected to increase under this scenario but their contribution to industry loss diminishes slightly as a result of larger increases in other states. These counties are in southern California where relatively small increases in burn area are projected, except in the Southern California Mountains (8).
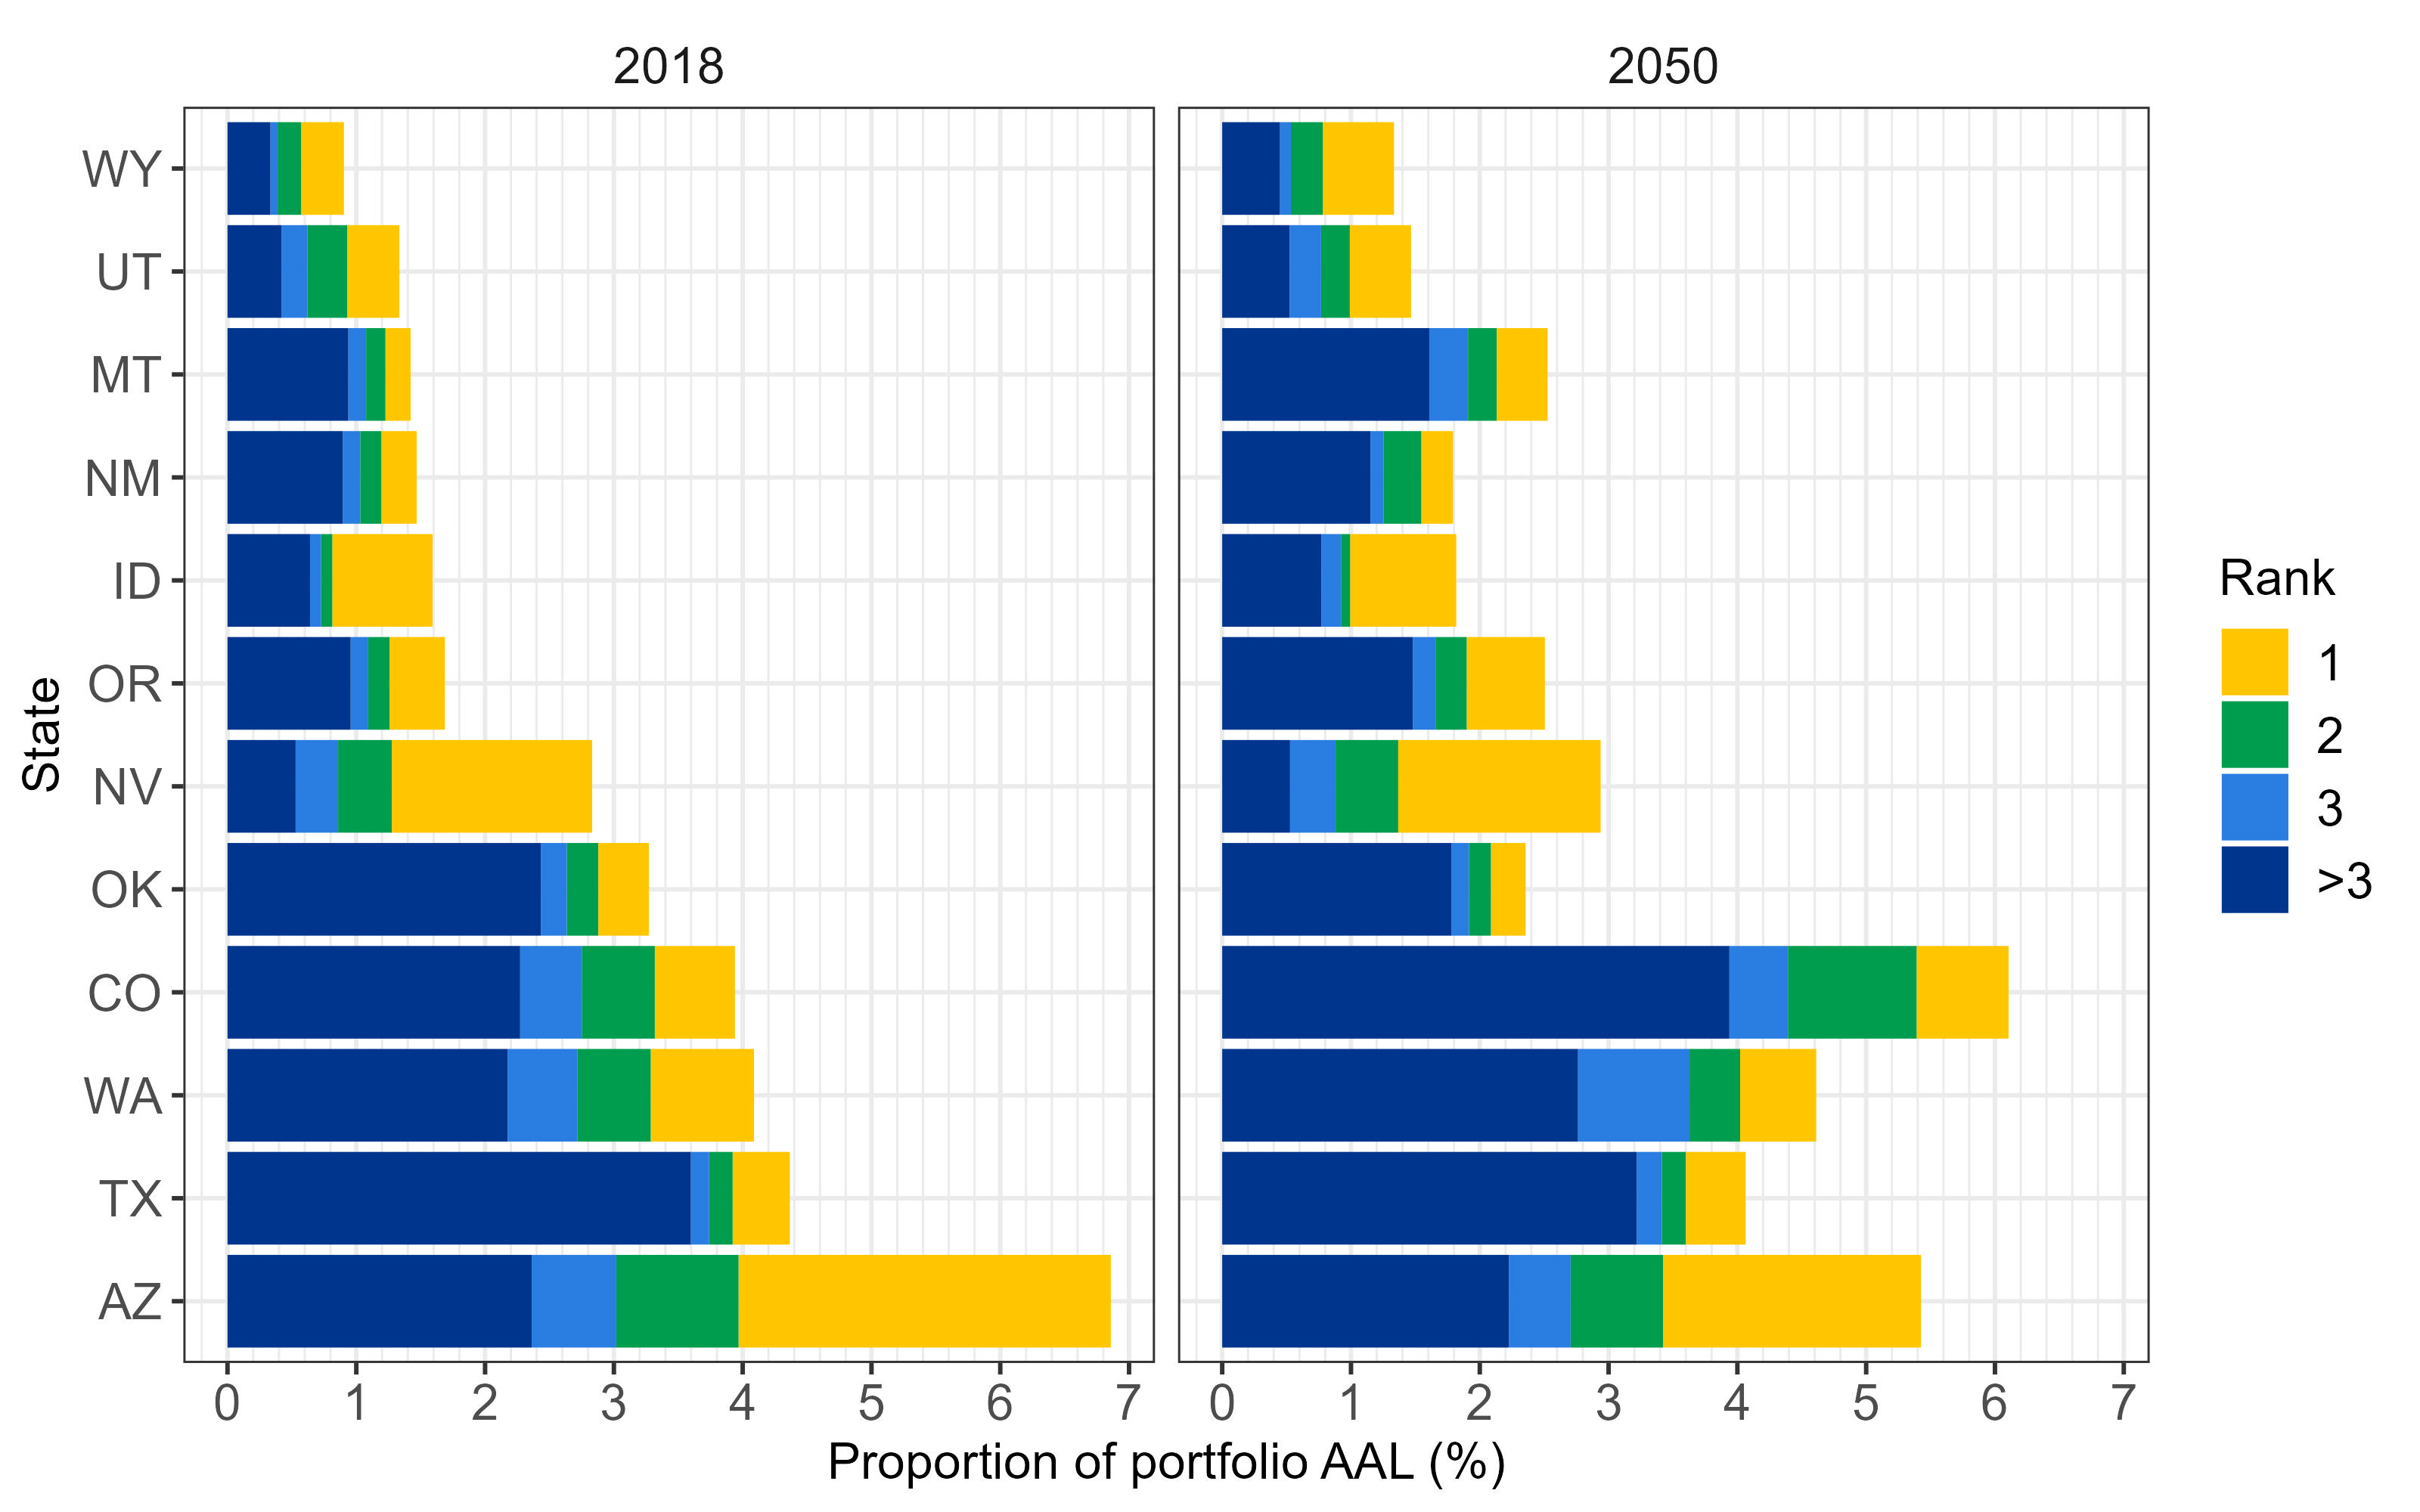
For all states except California, the proportion of portfolio AAL (%) in 2018 and 2050 under SSP2-4.5 and the proportion of each state’s top three contributing counties (yellow, green, light blue) and remaining counties combined (dark blue) shows the contributions made by the remaining 12 states outside of California in 2018 and 2050 under SSP2-4.5. The names of the top three contributing counties in each state are provided in Top three counties in each state that contribute to the present-day industry average annual loss (AAL). in the Appendix.
At present, Arizona and Texas are the second and third most contributing states to the industry AAL but this is projected to change to Colorado and Washington respectively. Even though the losses increase in Arizona and Texas, the increases in Colorado and Washington are substantially larger. In Colorado, increases are driven by the changes in Boulder County and counties outside of the top three. The increase in Boulder is due to the increased burn area in the Southern Rockies. The increases in Washington are driven by the changes in Chelan County in the North Cascades. Oklahoma is the sixth most contributing state in the present-day but is projected to be the ninth by 2050 under SSP2-4.5, overtaken by Nevada, Idaho and Montana.
The changes in aggregate and occurrence losses at key return periods for the top five contributing states is described below.
Aggregate and occurrence losses for top five states
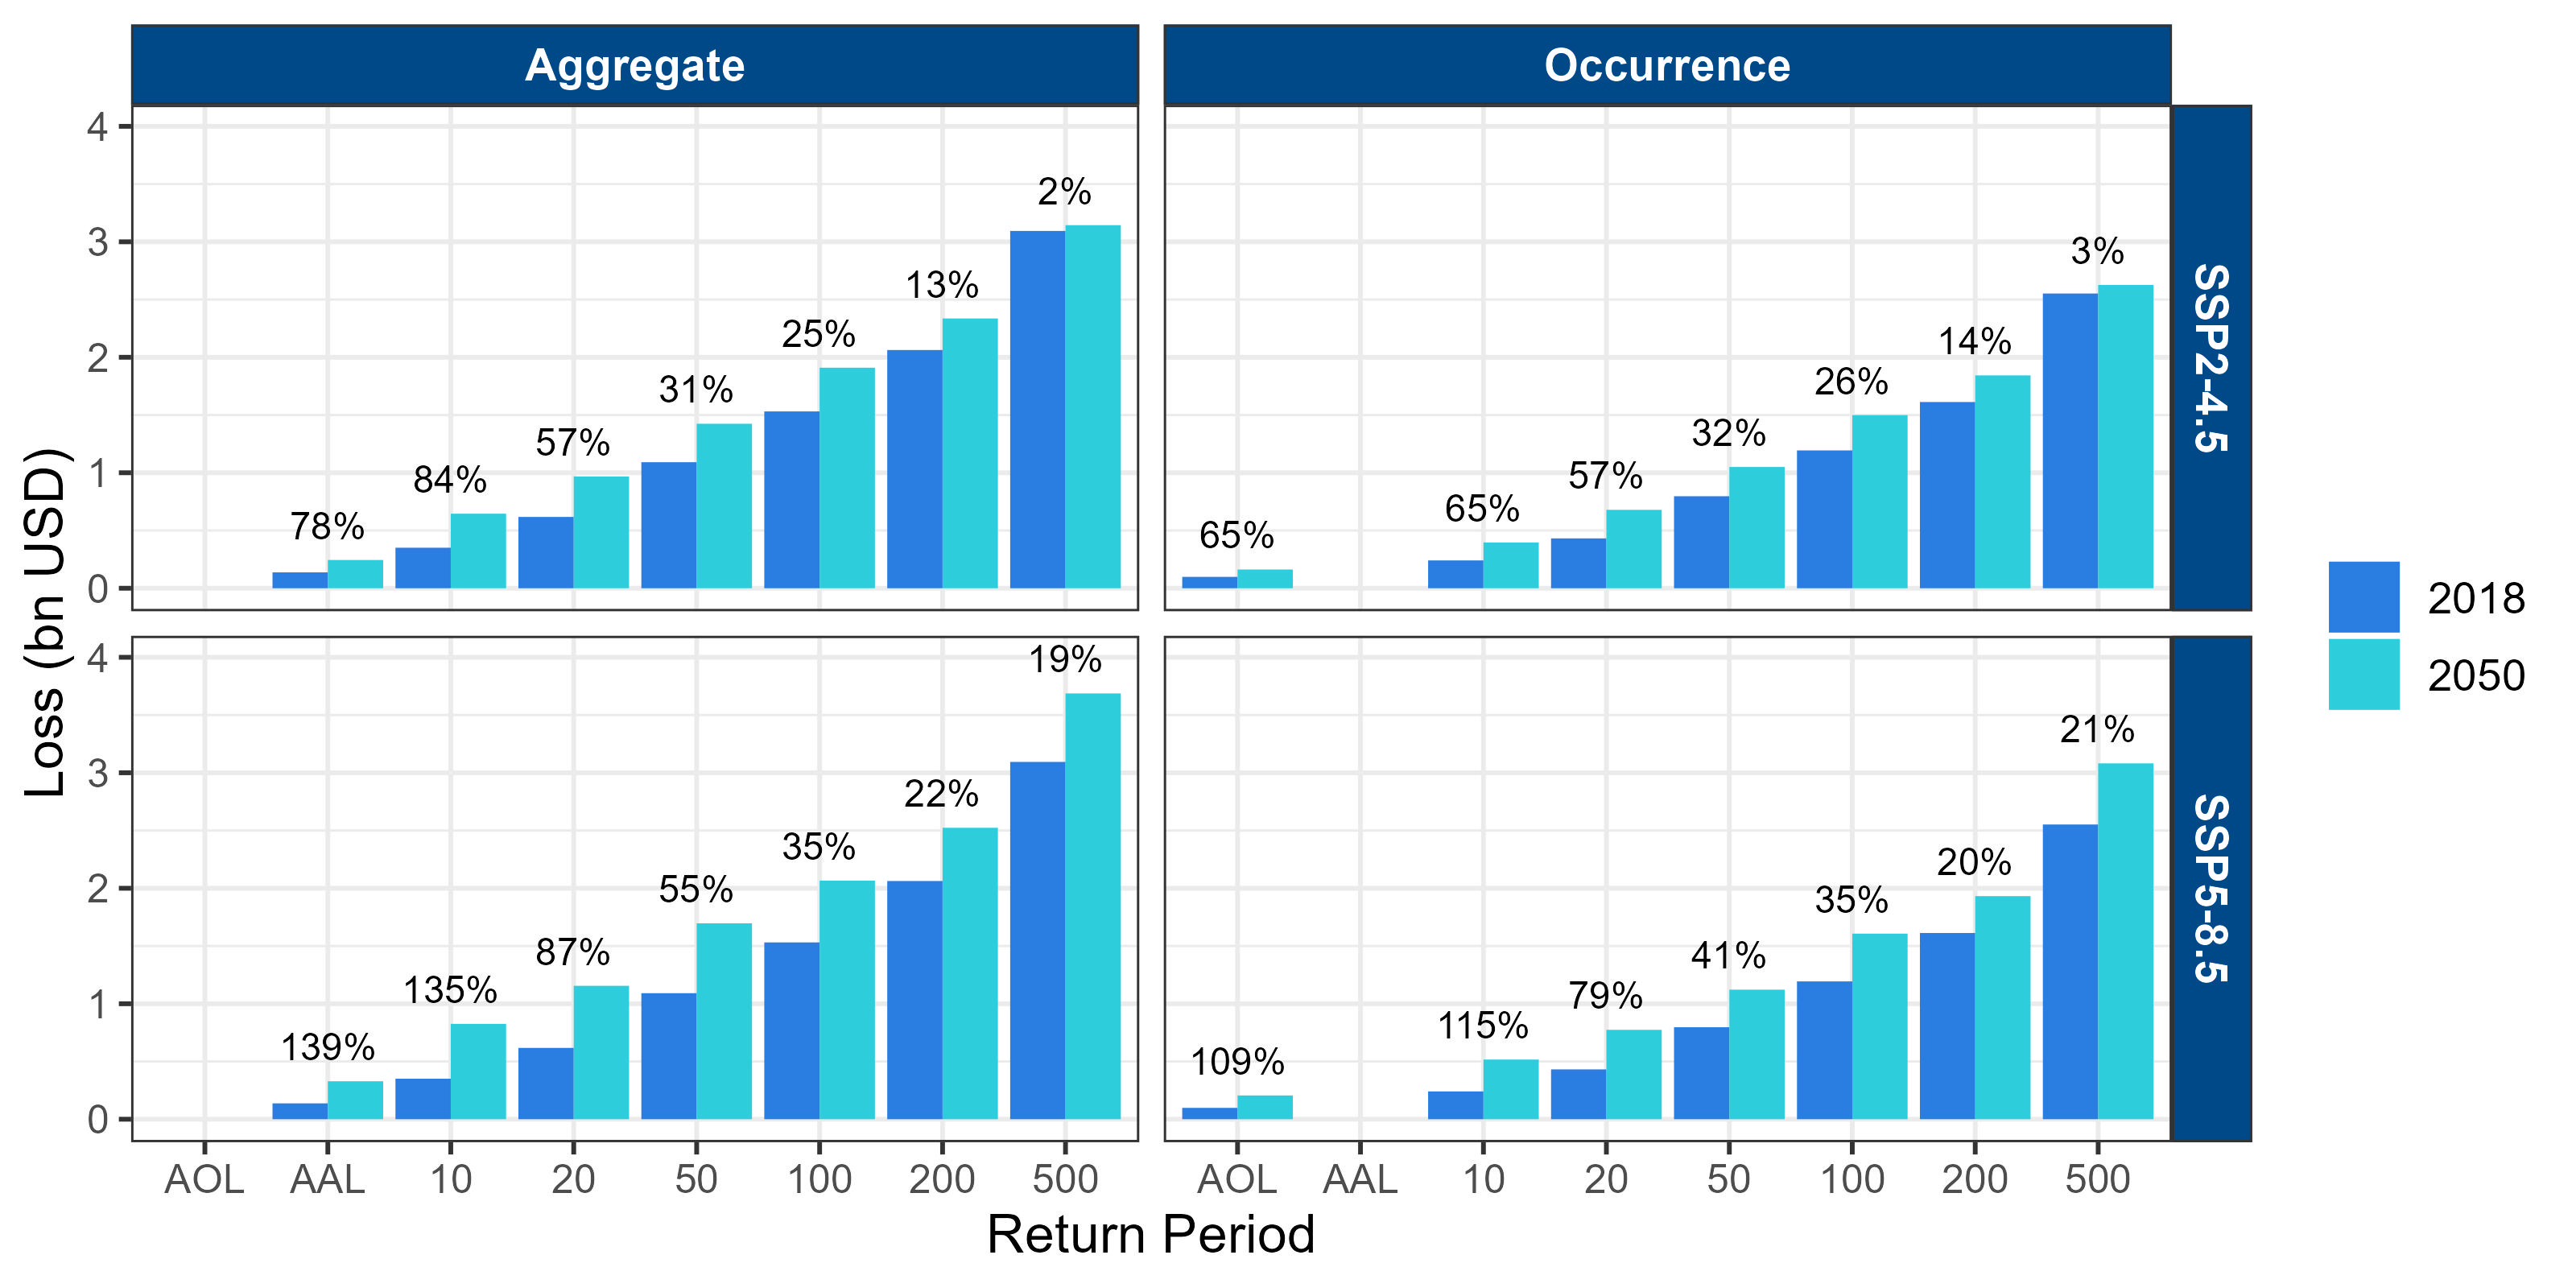
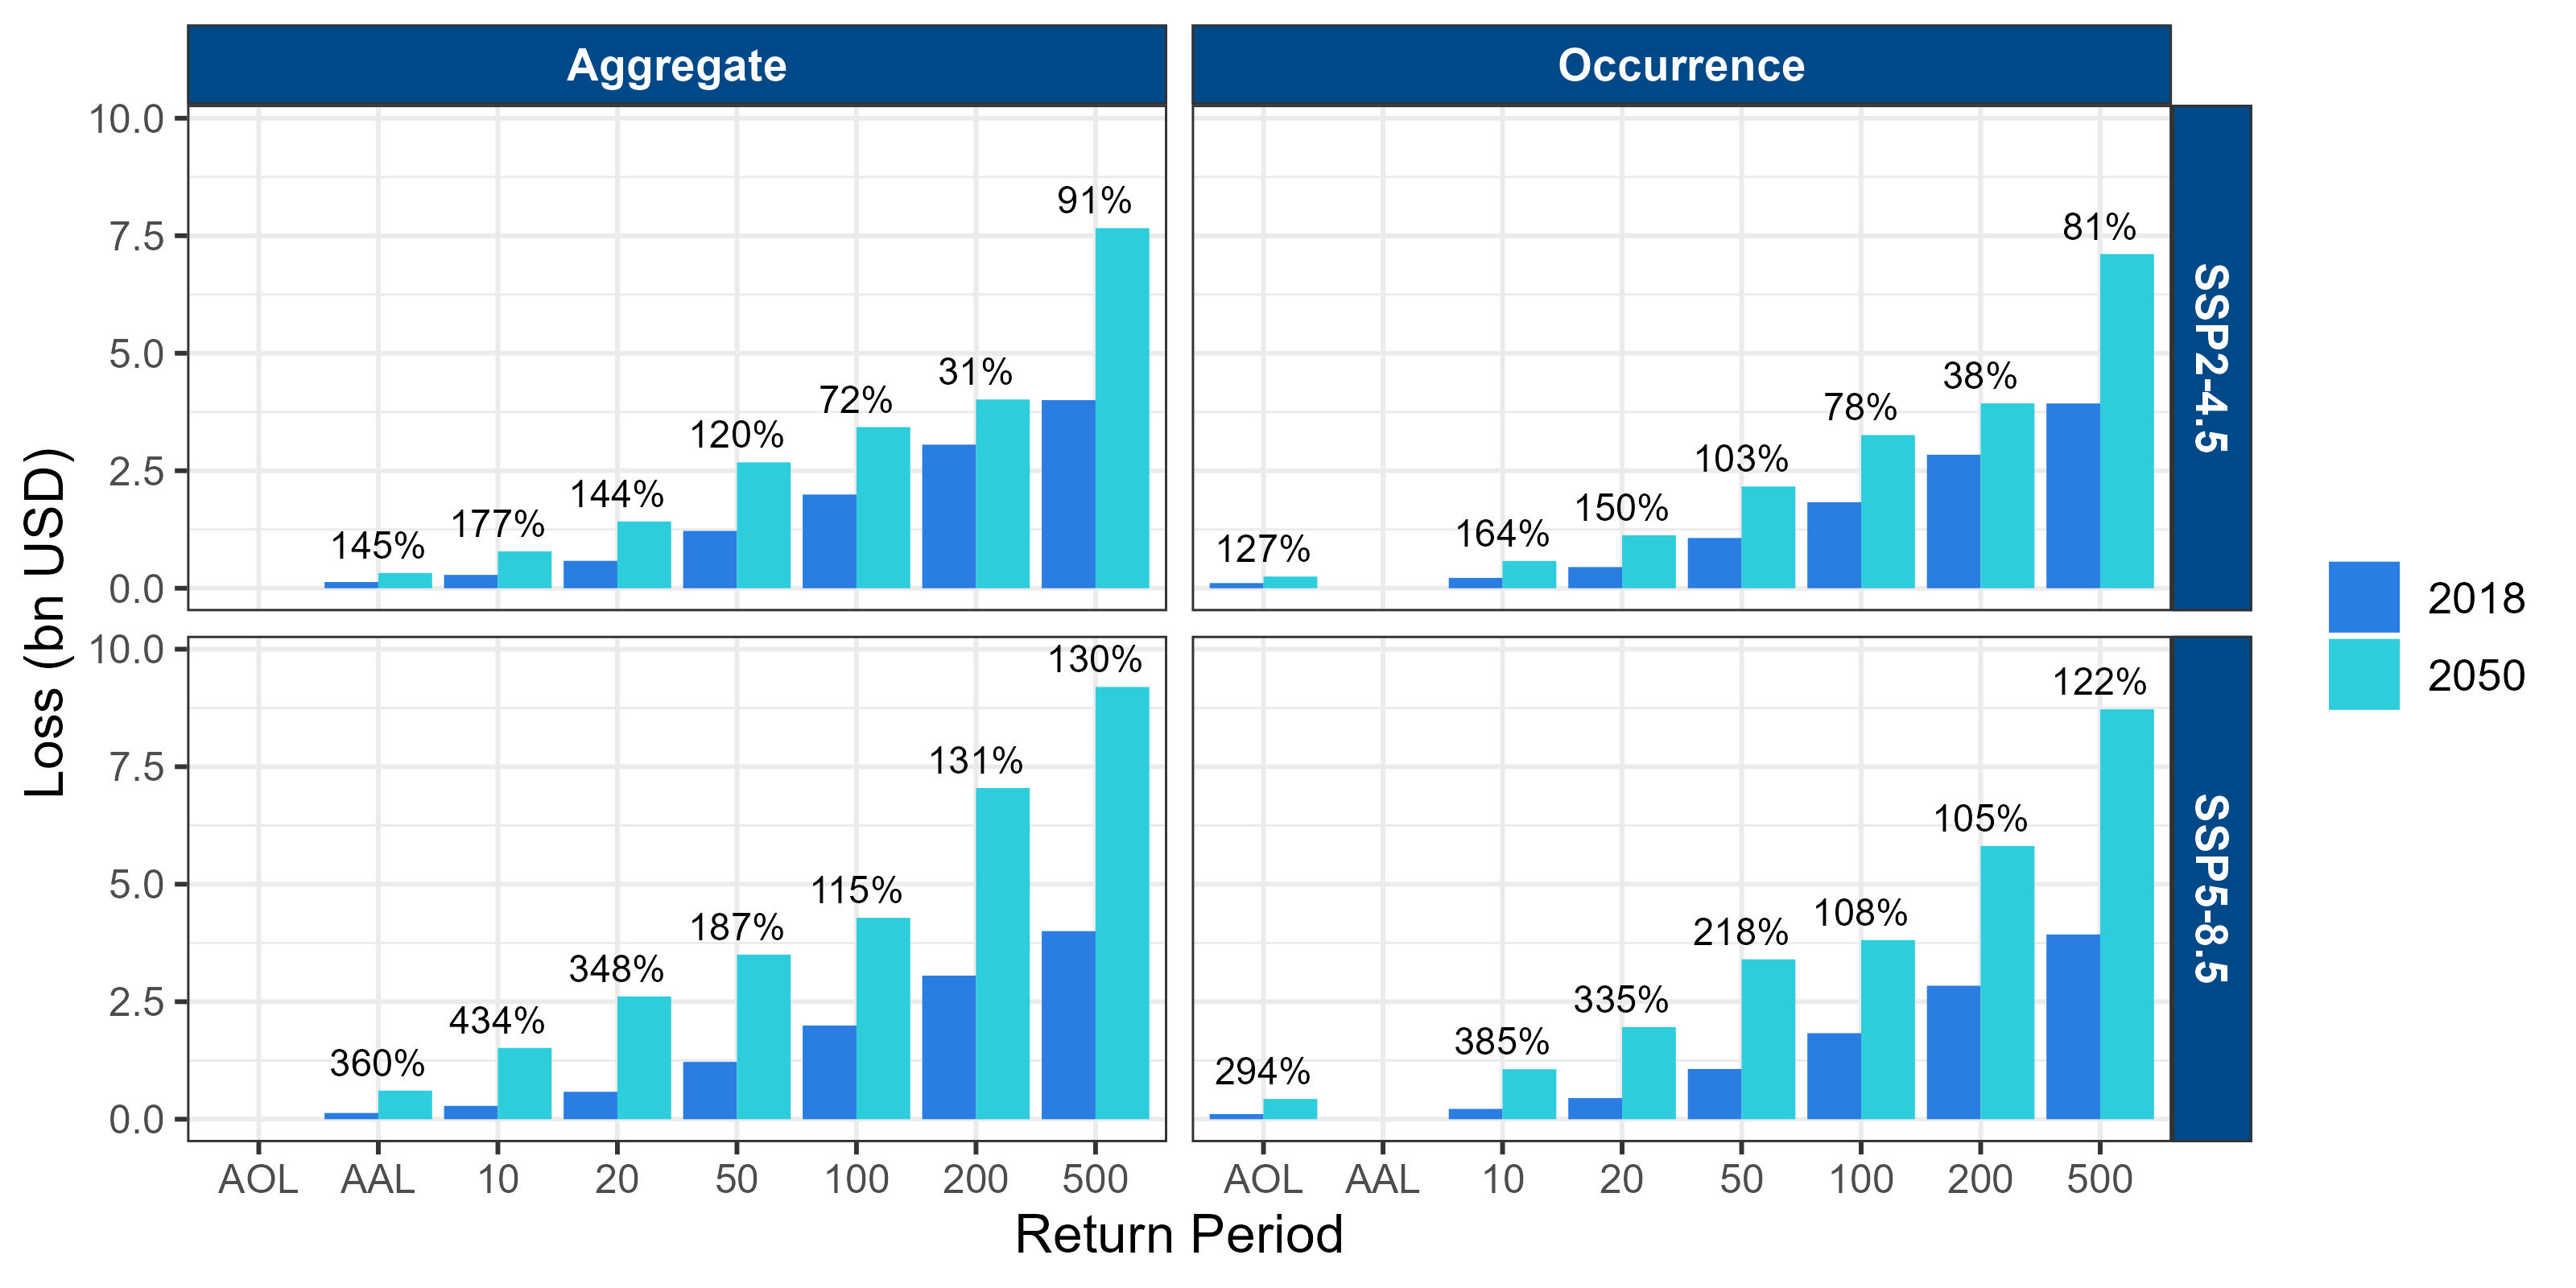
Absolute losses in California for the aggregate and occurrence average annual losses and losses exceeded at select return periods (years) for SSP2-4.5 and SSP5-8.5 at 2050. Changes (%) at 2050 relative to 2018 are written above each return period shows the absolute losses and projected changes in average annual losses and 10- to 500-year return periods for SSP2-4.5 and SSP5-8.5 at 2050 for California. The largest relative increases are in northern California but increases in and around El Dorado County in the Sierra Nevada and Contra Costa County in the Central California Foothills and Coastal Mountains significantly contribute to the absolute loss changes. The 100-year aggregate loss increases by 19% and 31% for SSP2 and SSP5 respectively.
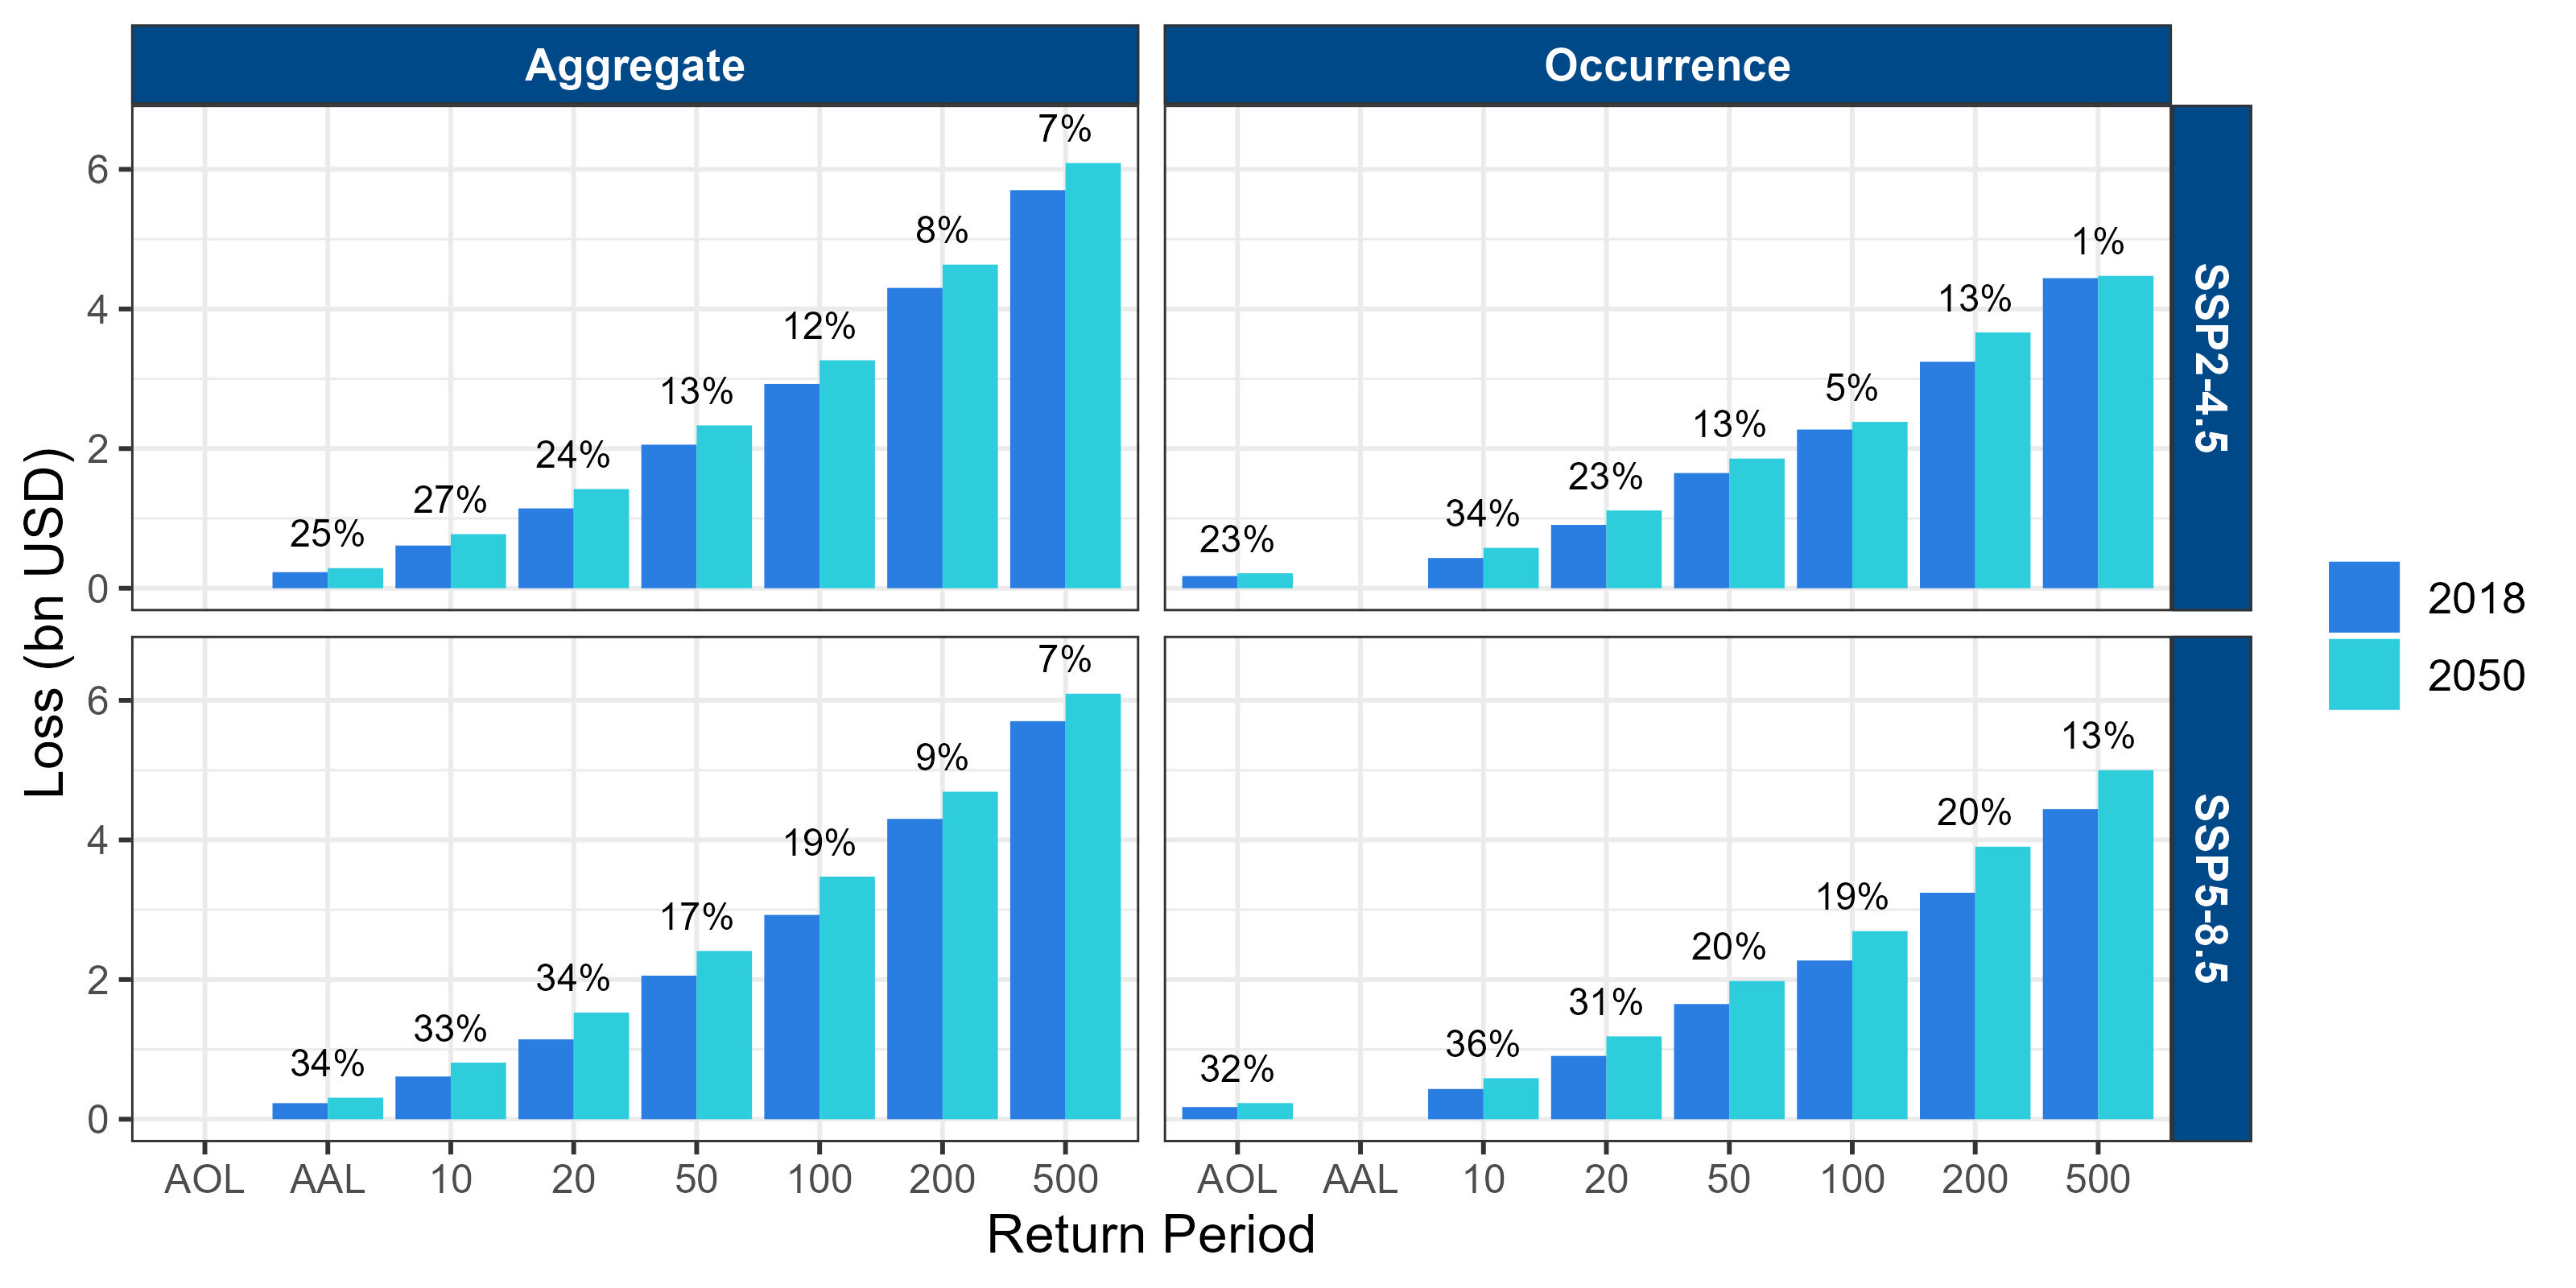
Absolute losses in Arizona for the aggregate and occurrence average annual losses and losses exceeded at select return periods (years) for SSP2-4.5 and SSP5-8.5 at 2050. Changes (%) at 2050 relative to 2018 are written above each return period shows the absolute losses and projected changes for Arizona under SSP2 and SSP5 at 2050. Increases are driven by the increases in Coconino and Navajo Counties in the Arizona/New Mexico Plateau and Mountains. The AAL in Maricopa, the largest contributing county, increases slightly in SSP2-4.5 but decreases in SSP5-8.5, but at the state-level the SSP5-8.5 AAL is higher than that in SSP2-4.5.
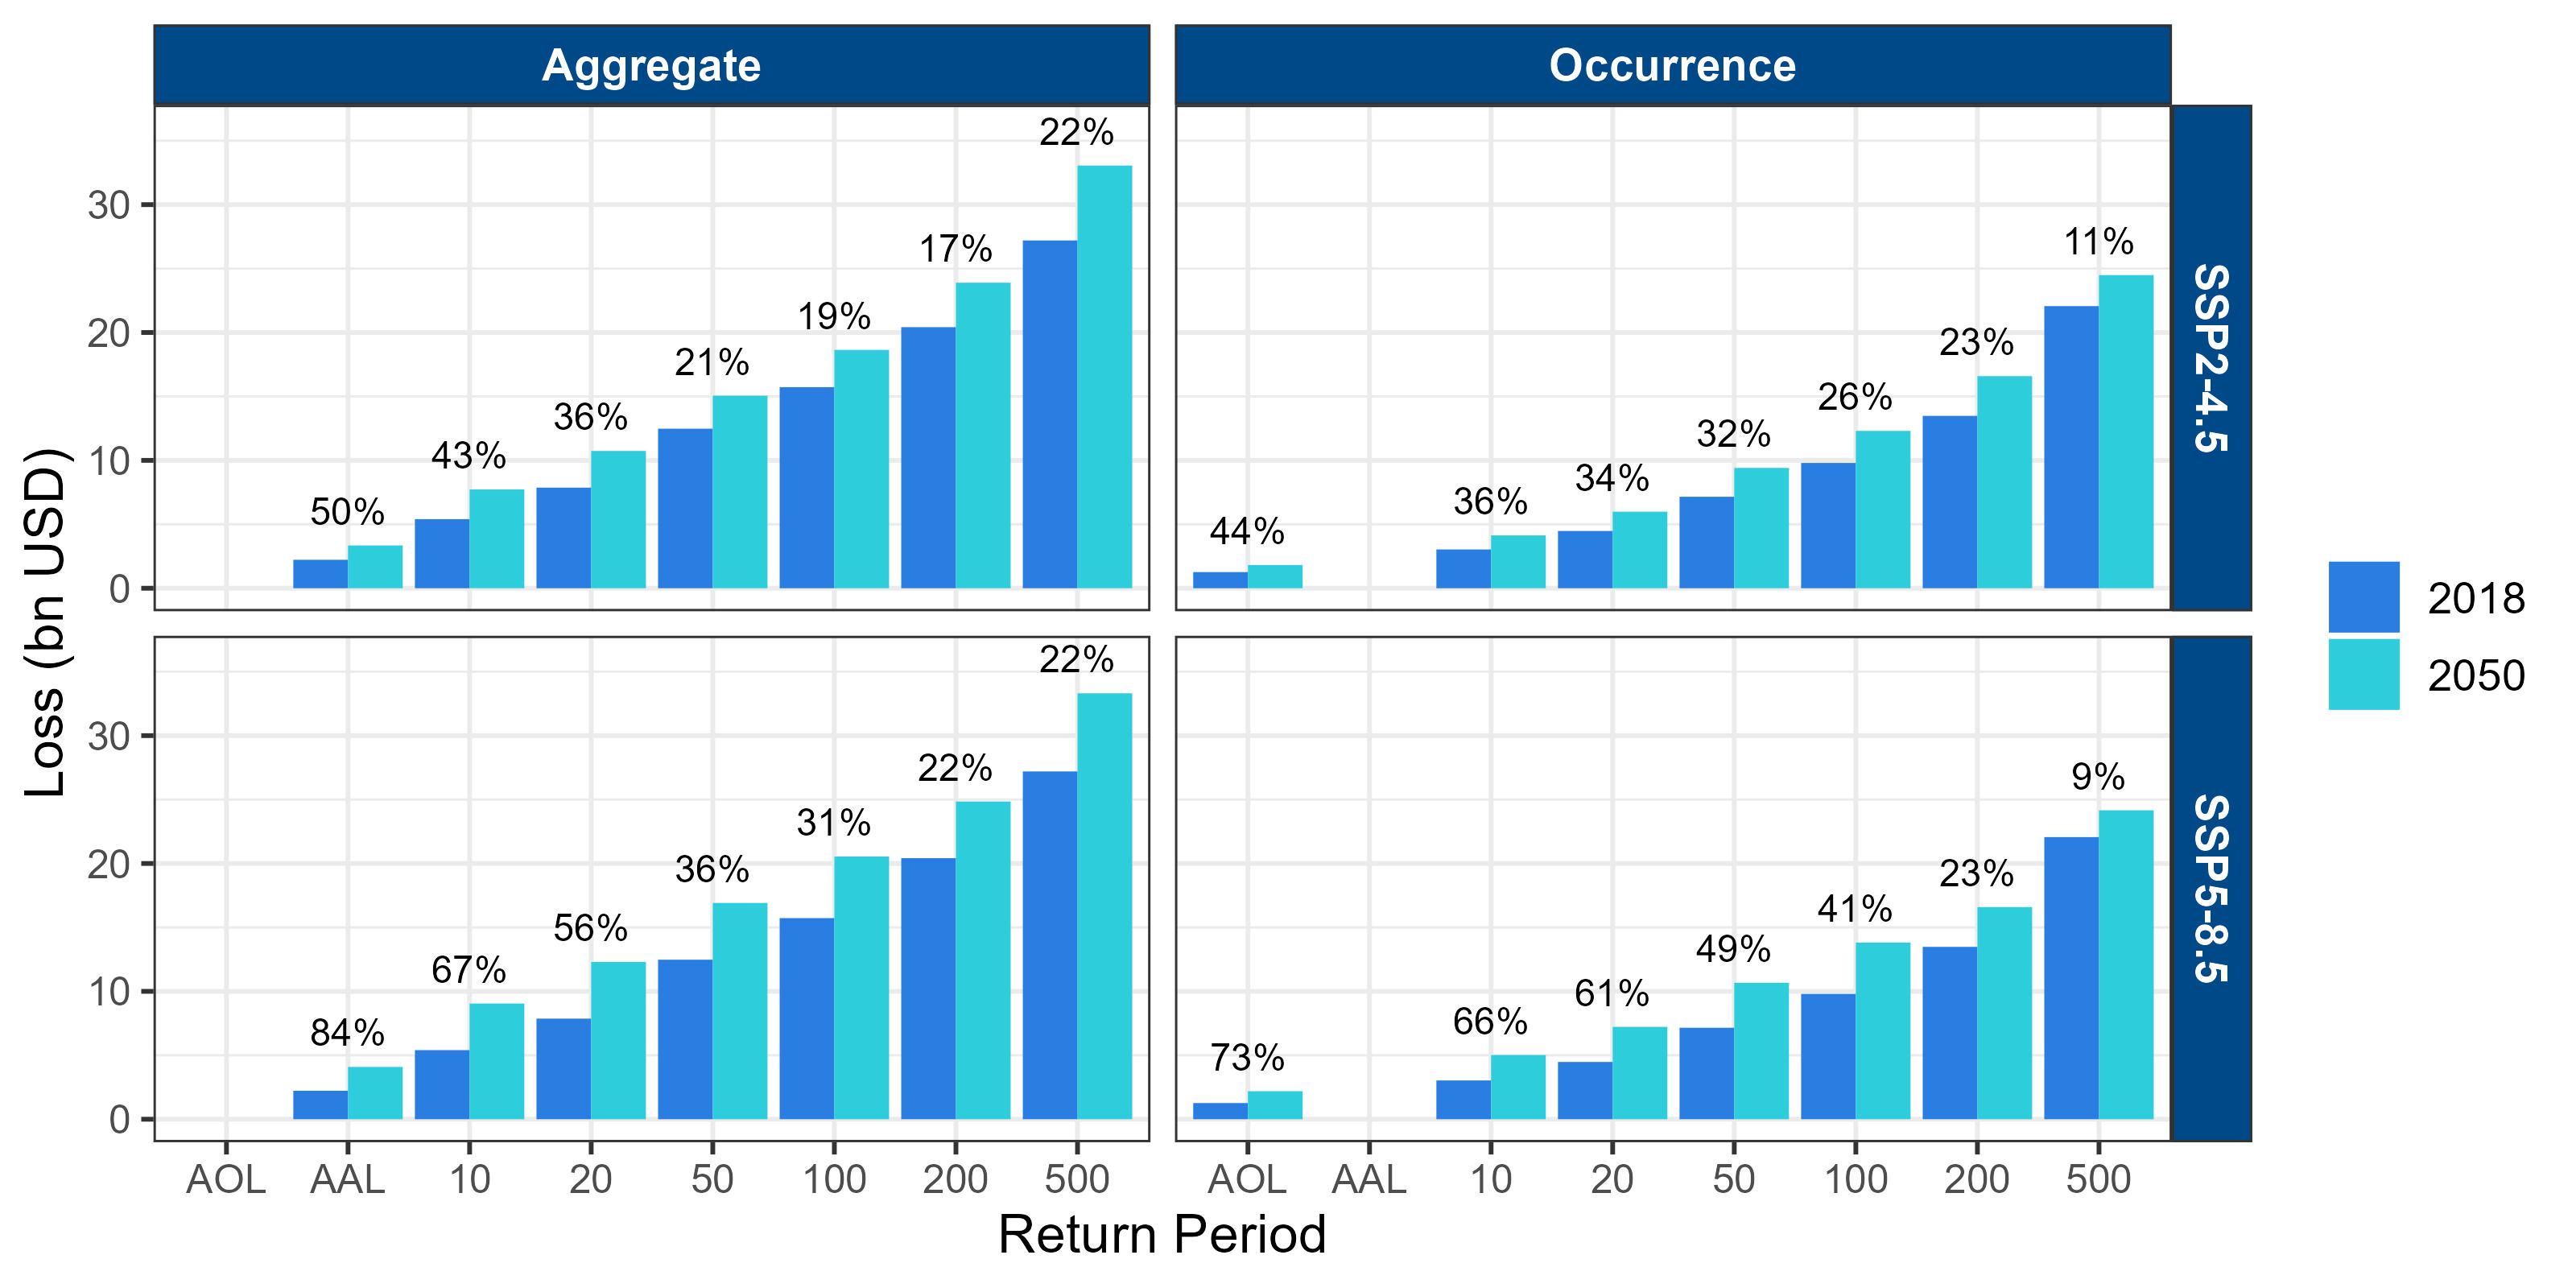
Absolute losses in Texas for the aggregate and occurrence average annual losses and losses exceeded at select return periods (years) for SSP2-4.5 and SSP5-8.5 at 2050. Changes (%) at 2050 relative to 2018 are written above each return period shows the absolute losses and projected changes for Texas under SSP2 and SSP5 at 2050. The largest relative changes in AAL in Texas are in western Texas however there is little exposure there in the present-day. The highest contributing counties in Texas are between Edwards Plateau (ecoregion 30) and the Southern Texas Plains (31). There are mild increases in burn area in Edwards Plateau but little to no change in the Plains. There is a notably high increase in the 100- to 500-year losses particularly in SSP5-8.5 so even though climate change is projected to have a relatively moderate impact in the average annual losses in Texas, there could be significantly large increases in loss from rare events.
Absolute losses in Washington for the aggregate and occurrence average annual losses and losses exceeded at select return periods (years) for SSP2-4.5 and SSP5-8.5 at 2050. Changes (%) at 2050 relative to 2018 are written above each return period shows the absolute losses and projected changes for Washington. Most of the present-day AAL is in North and Eastern Cascades and the Columbia Plateau. The increased risk here is driven by changes in the North Cascades where Chelan and Okanogan Counties are located.
Absolute losses in Colorado for the aggregate and occurrence average annual losses and losses exceeded at select return periods (years) for SSP2-4.5 and SSP5-8.5 at 2050. Changes (%) at 2050 relative to 2018 are written above each return period shows the absolute losses and projected changes for Colorado. The present-day AAL is mainly in central Colorado near or in the Southern Rockies (for example Boulder County) and western Colorado in the Colorado Plateau where Garfield and Mesa Counties are located. The Southern Rockies and Colorado Plateau are projected to see high and moderately high increases in burn area respectively.