Climate-fire statistical models
Statistical models were developed between scaled seasonal VPD and/or scaled precedent precipitation and annual burn fraction for each ecoregion in the model domain. Two versions of the statistical model were developed: the static model which does not account for fire-fuel feedback and the dynamic model which does (Abatzoglou et al., 2021).
Static model
In the static model, a function g of the annual burn fraction is a linear combination of seasonal VPD and precedent precipitation:
Equation 1:
where g is the link function, B is the annual burn fraction, is time, , and are unknown parameters, is a random error term , and v(t) and p(t) are the seasonal VPD and precedent precipitation, respectively.
The link function g is a transformation function that links a linear combination of the explanatory variables (v and p) to the response variable (B). Here the logit function is used since it transforms variables that have positive values (zero to infinity), to a variable that only has values between zero and one.
Dynamic model
The static model accounts for climate influences alone, but the dynamic model also accounts for how a fraction of the ecoregion, called the lost fraction, has been made temporarily unavailable to burn due to the preceding years of wildfire activity. This effect is called temporary fire-fuel feedback. In the dynamic model, the function g of the annual burn fraction and lost fraction are related to a linear combination of scaled seasonal VPD and scaled precedent precipitation:
Equation 2:
where αd, βd,v and βd,p are unknown parameters for the dynamic model, L is the lost fraction, is a random error term, g and B are the logit link function and annual burn fraction, v(t) and p(t) are the seasonal VPD and precedent precipitation, respectively.
In the dynamic model, wildfires that occurred in the previous τ years reduce the area available to burn in the modeled year. This feedback effect more heavily weights recent wildfires over older ones with a constant weighting given to the most recent σ years and lesser weighting put on older years up to τ years through a sinusoidal function:
Equation 3:
where γ is the fuel-limitation strength.
Abatzoglou et al (2021) present acceptable value ranges for τ, σ and γ of 15 to 30 years, 5 years, and 0.5 to 1.5 respectively. Verisk explored the sensitivity of burned area projections to τ and γ including a mapping of τ to mean seasonal VPD. Higher values of γ always lead to lower projections whereas higher values of τ generally lead to lower projections. The size of the historical burn dataset is a key limitation; a consideration in the selection of τ is that higher values of τ means there is less data on which to build the model, potentially limiting the influence of high burn area years in the historical record for some ecoregions. Verisk scientists selected τ to align with accepted literature values while also preserving the amount of historical data used to build the model.
To create the burned area projections, τ was set to be 15 years, σ was set at 5 years and γ at 1.5. A physical argument for taking a γ value higher than 1 is that the previous wildfire years created barriers that prevent wildfires spreading to areas with more fuel.
The dynamic model is used for 31 ecoregions1 and the static model for the remaining 18. The dynamic-modeled ecoregions were selected by computing the Pearson correlation coefficient between the logarithm of the annual burned area and the seasonal VPD from 1984 to 2020 to estimate the strength of the response and ecoregion 3’s coefficient is used as a threshold. These ecoregions tend to have lower mean seasonal VPD and higher forest fractions.
With τ equal to 15 years, the years 1984 to 1998 were used to compute the lost fraction for 1999 and onwards. The unknown parameters for the static and dynamic models were quantified through a regression on the 1999 to 2020 historical data. For all ecoregions except ecoregion 40, a generalized linear regression model (GLM) with Gamma error distribution and logit2 link function is fitted using the R base library (v4.1.2; R Core Team, 2021). This GLM is suited to modeling multiplicative processes where the predictor variables vary linearly, and the response variable varies over several orders of magnitude. For ecoregion 40, a Bayesian regression model with Beta error distribution and logit link function was fitted using the brms library (Bürkner, 2017). The Beta family is preferred here to reduce the weighting on exceptionally high burned area years which cannot be explained well by VPD or precipitation and weights the fit towards most years resulting in a response that can be partly explained by VPD.
The selection of whether to include VPD, precipitation or both as explanatory variables was determined using the static model for all 49 ecoregions and the 1984 to 2020 historical record. Ecoregions could only be candidates for including both variables if burned area was positively correlated to VPD and precipitation which is consistent with the expectations for direct and facilitative climate influences. The most parsimonious model for each ecoregion was identified by preferring the combination which gave the lowest Akaike Information Criterion (AIC) and better fit. In some ecoregions, even though the inclusion of precipitation gave a slightly lower AIC, VPD alone was preferred because of the added uncertainty in future precipitation projections (e.g., ecoregion 78). In summary, 35 ecoregions were modeled using only VPD3 , 6 were modeled using only precipitation4, and 9 were modeled using both5.
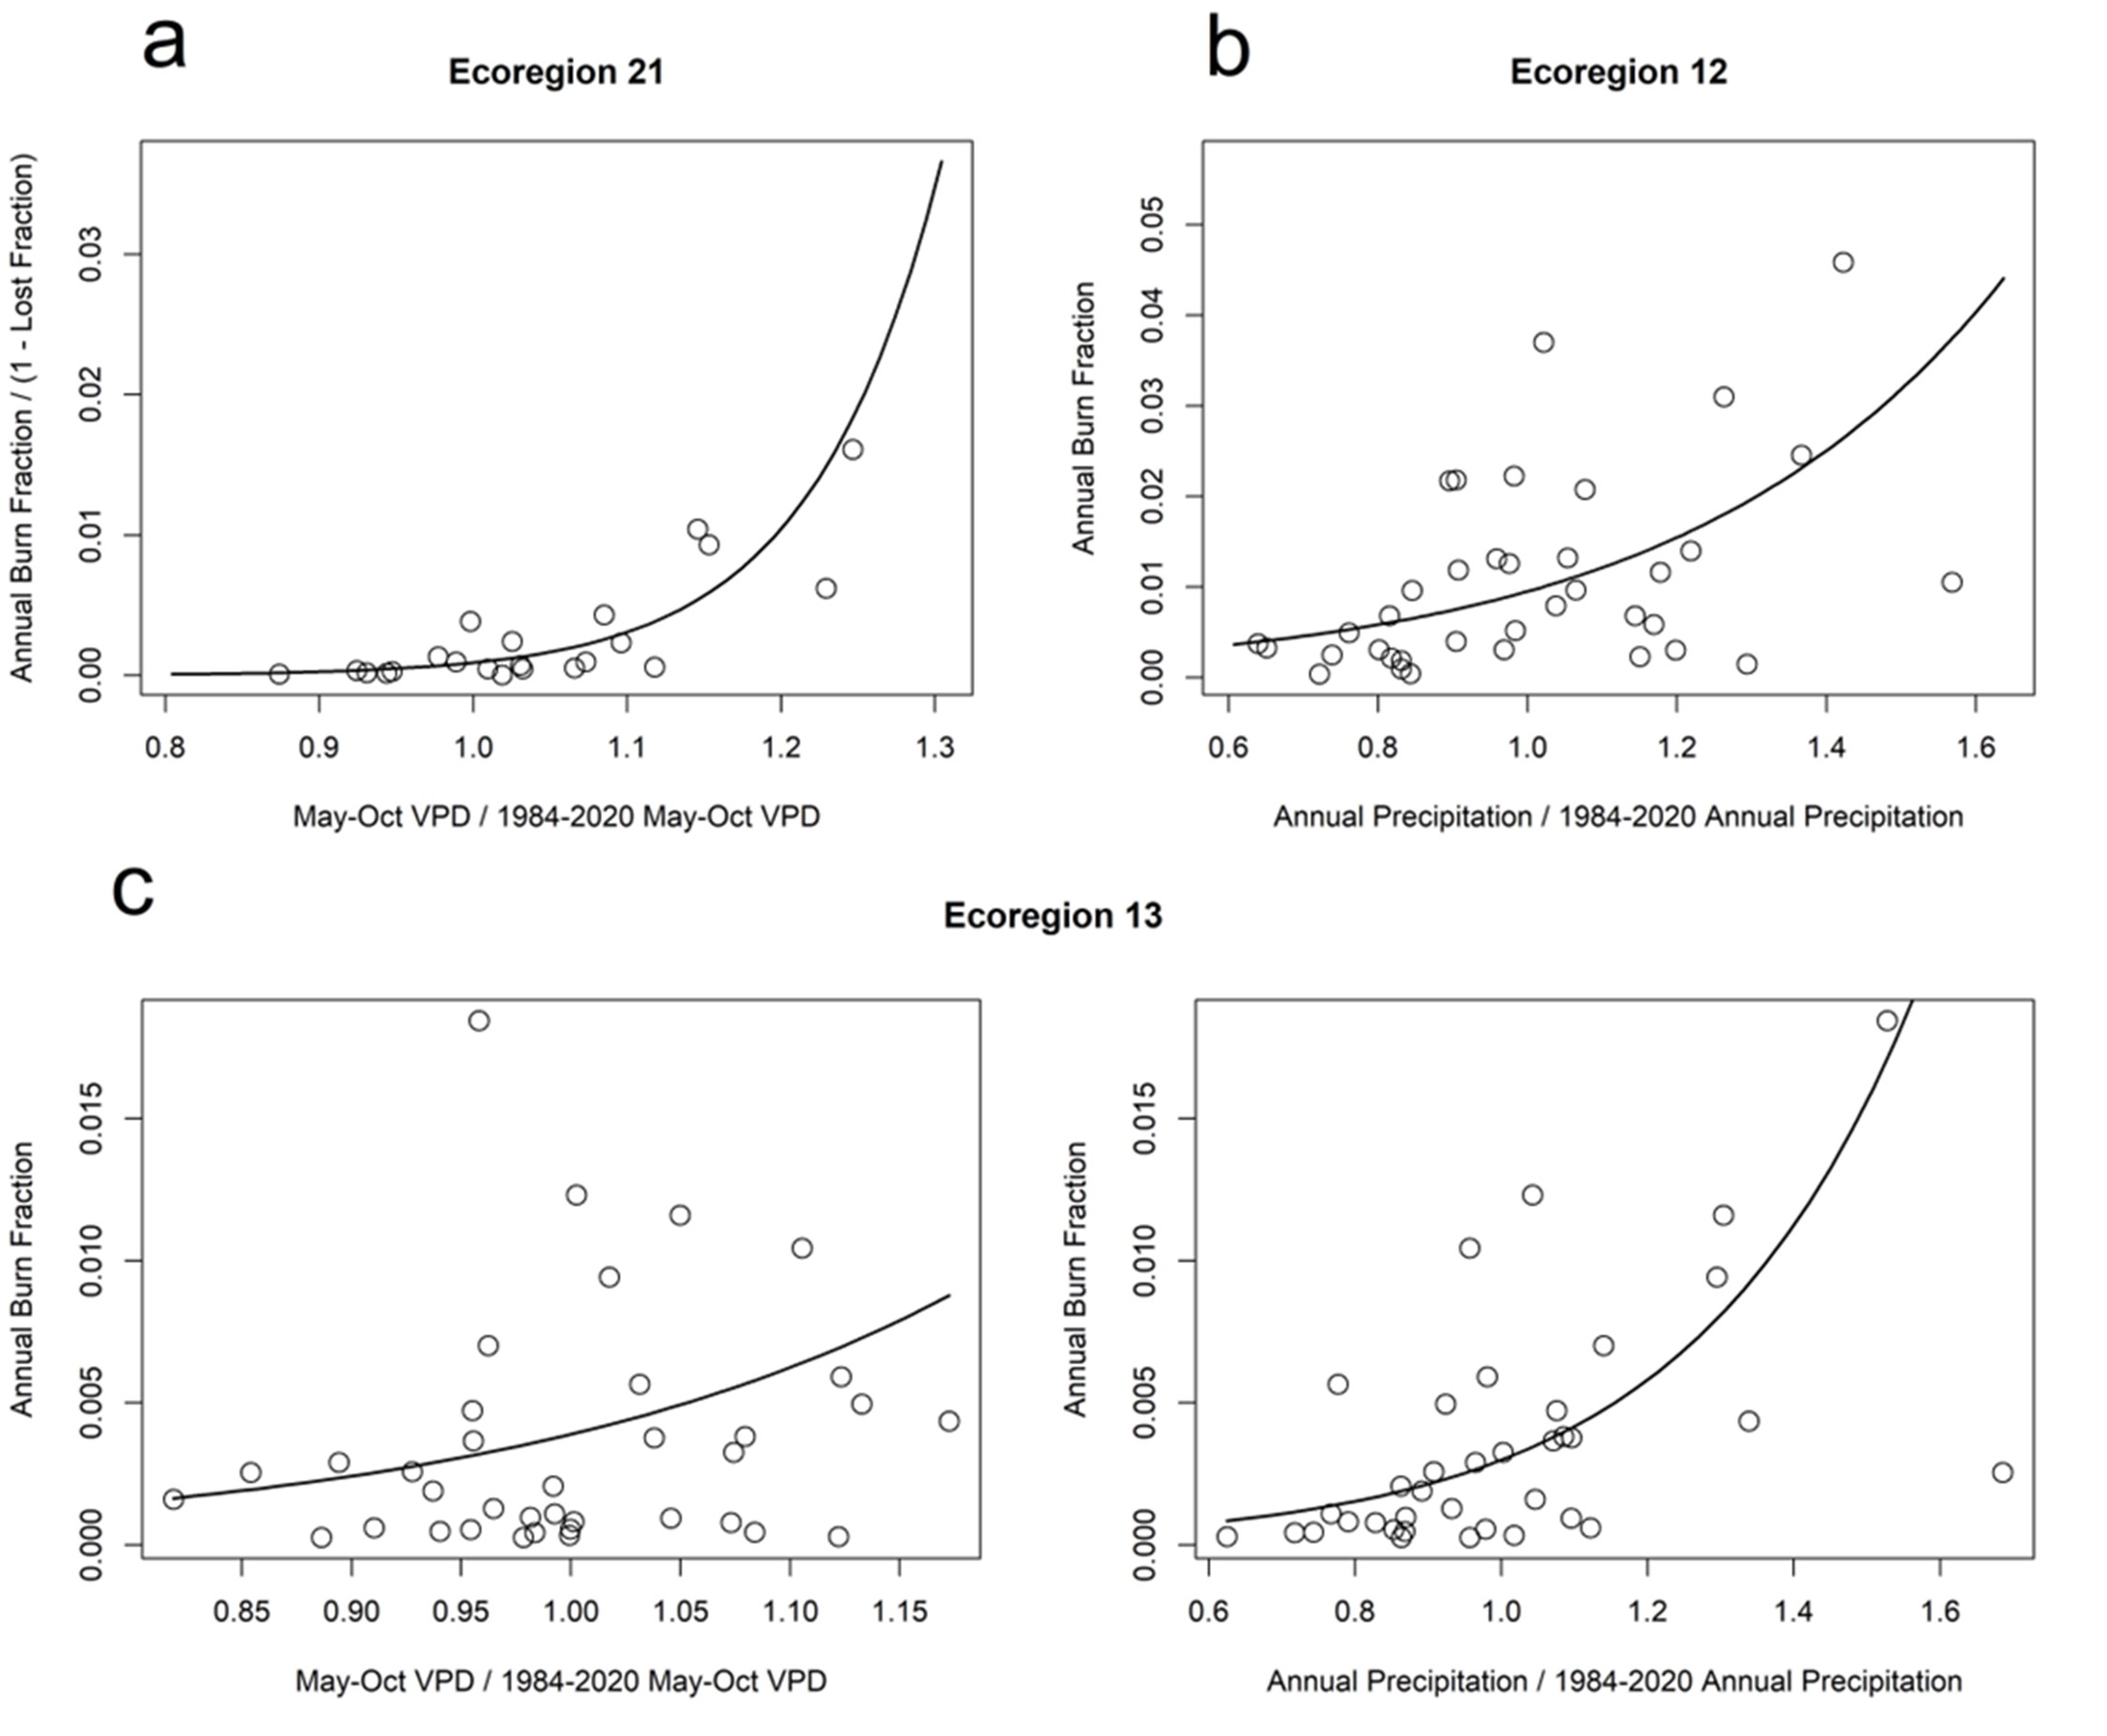
Solid lines are linear models, circles are historical observations. Panel a shows ecoregion 21 scaled VPD, panel b shows ecoregion 12 scaled precipitation, the bottom panels show ecoregion 13 scaled VPD and scaled precipitation.

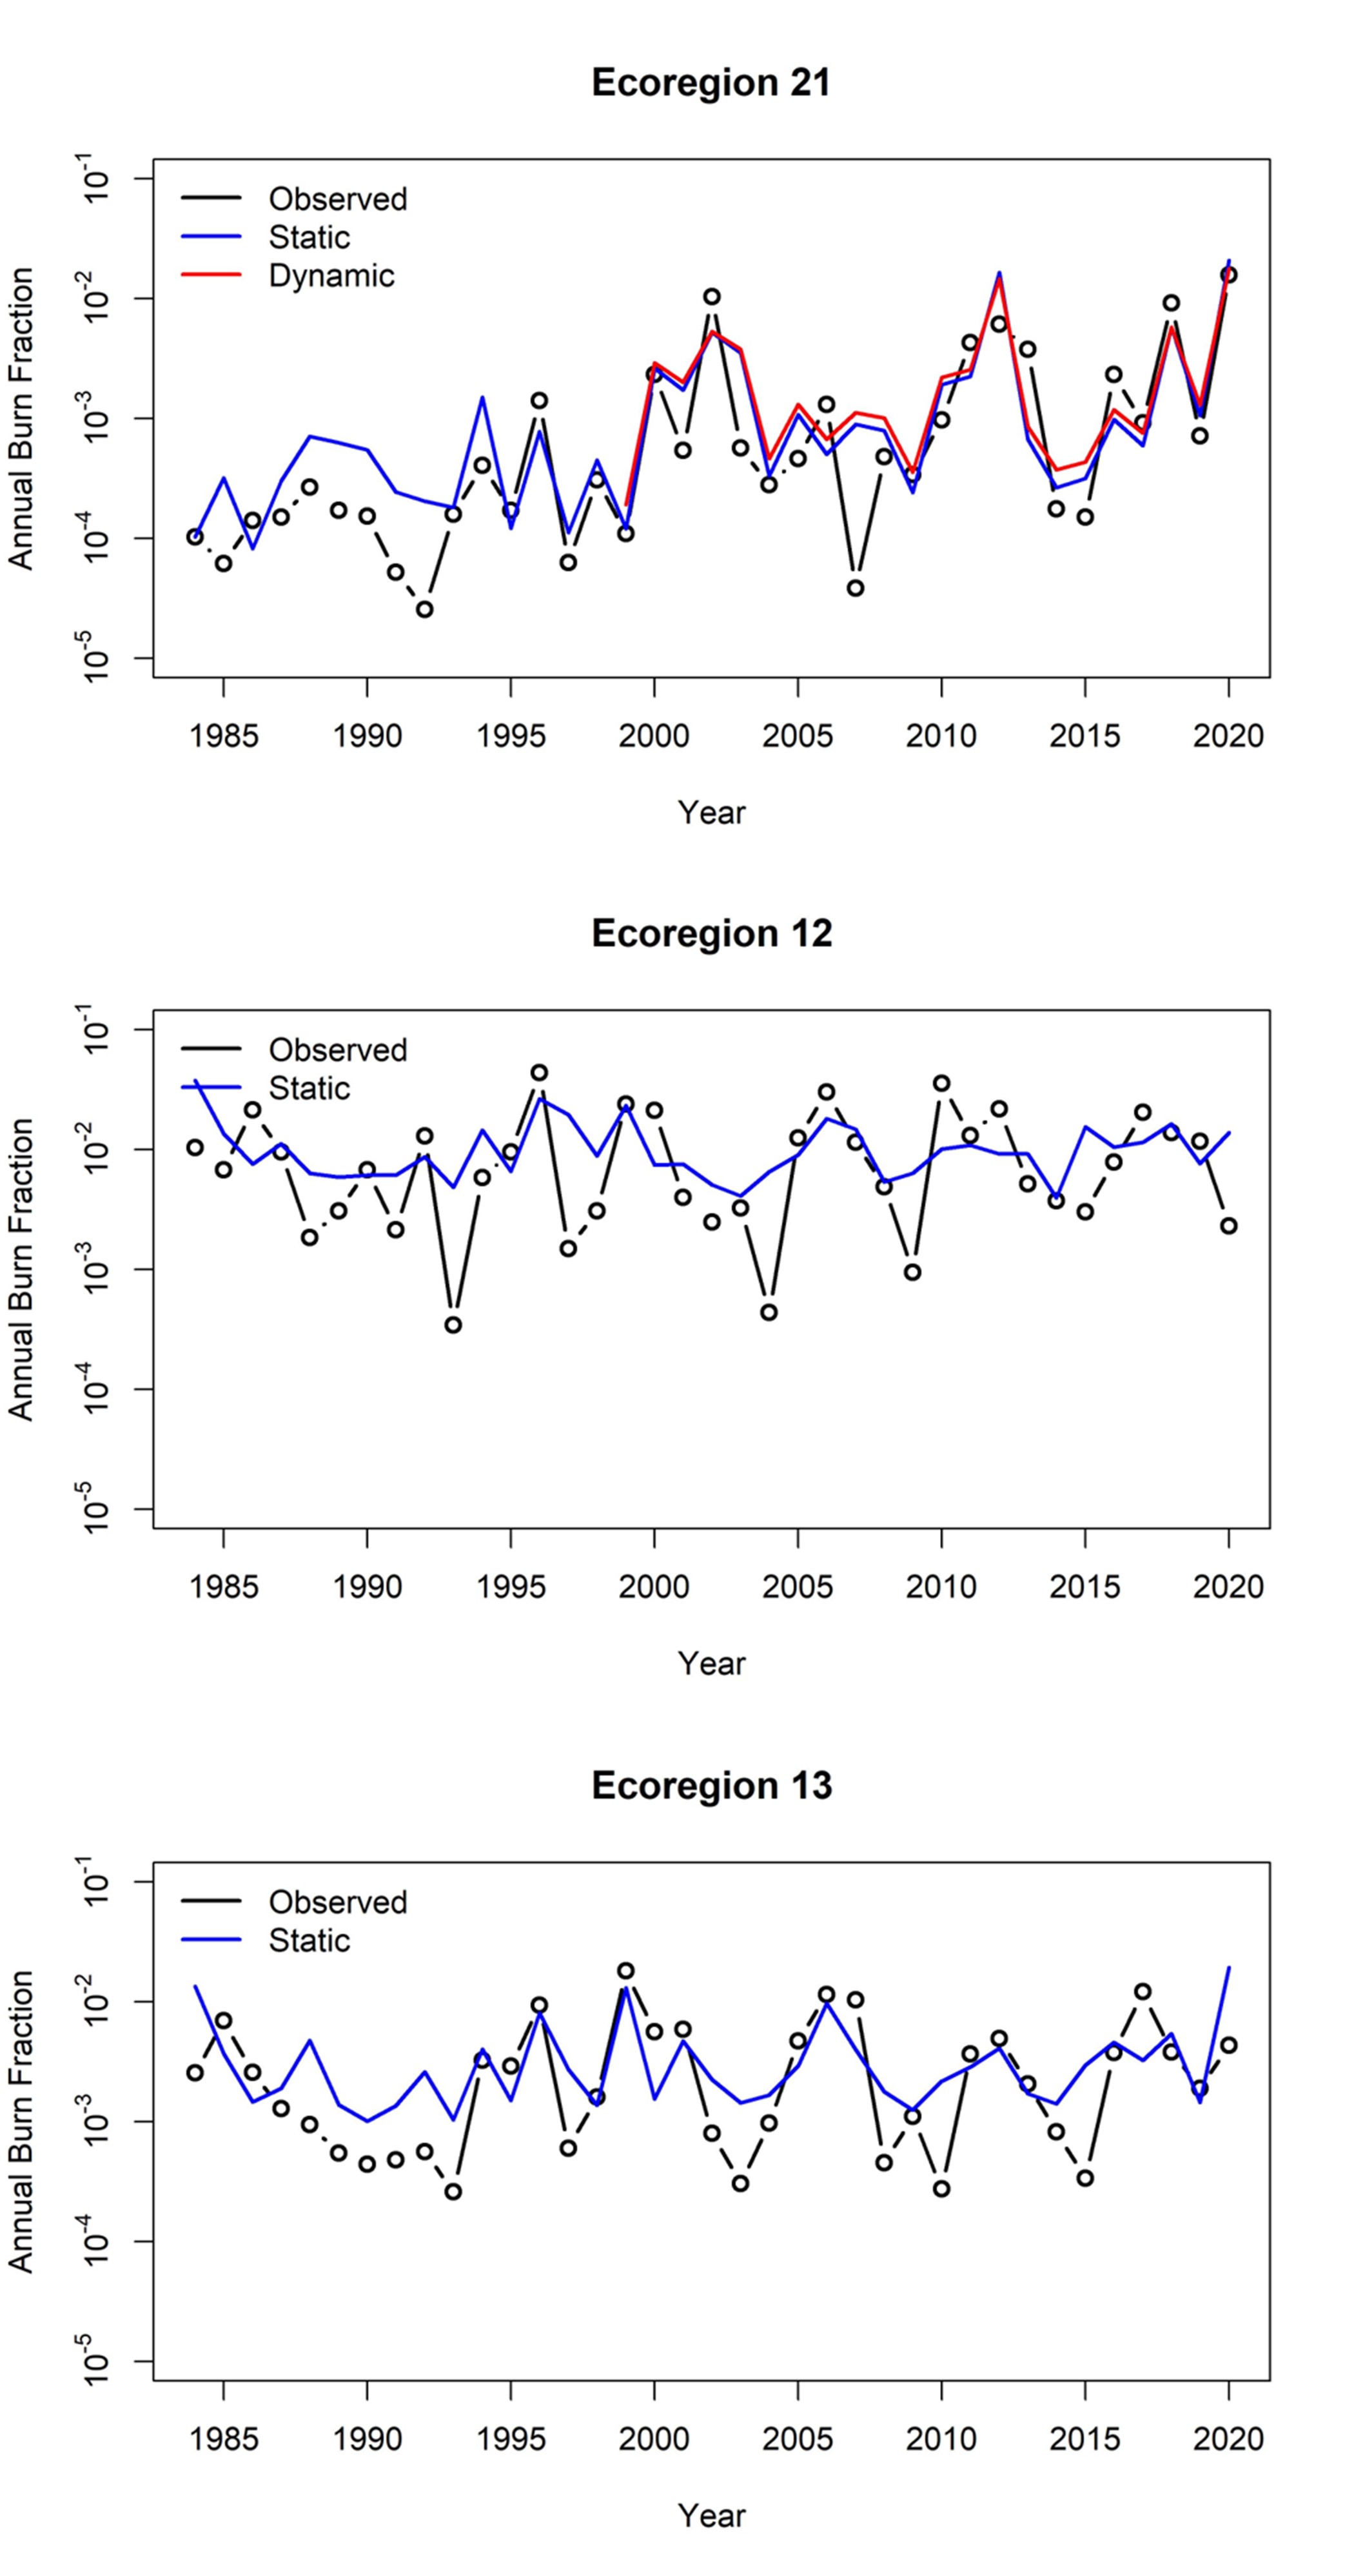
Static model results are in blue, dynamic model results are in red, observations are in black. Static and dynamic model results for ecoregion 21 are shown in panel a. Static model results for ecoregion 12 is shown in panel b. Static model results for ecoregion 13 is shown in panel c.

