Projecting future burn area
Future projections in average annual burn fraction for the 49 ecoregions were computed using the VPD and precipitation projections from the six selected GCMs and the static and dynamic statistical models.
For ecoregions that do not include fire-fuel feedback, average annual burn fraction from 1950 to 2100 is simulated by importing the VPD and precipitation 1950 to 2100 timeseries into the static model and computing the response.
For ecoregions that include fire-fuel feedback, the simulation occurs in three stages. The first stage simulates annual burn fraction from 1950 to 1983. Since burn fraction and lost fraction need to be calculated simultaneously, an iterative scheme is used in the first stage. In the second stage, the right-hand side of Equation 2 is simulated for 1984 to 2100 using the VPD and precipitation 1984 to 2100 timeseries. This result represents the average annual burn fraction predicted by the climate only and does not account for feedback. The third stage is a time-stepping scheme where average annual lost fraction and then average annual burn fraction are computed year-by-year from 1984 to 2100. For example, the lost fraction is computed for 1984 using the burn fractions from 1969 to 1983, then the burn fraction for 1984 is computed from the lost fraction and the climate-only burn fraction.
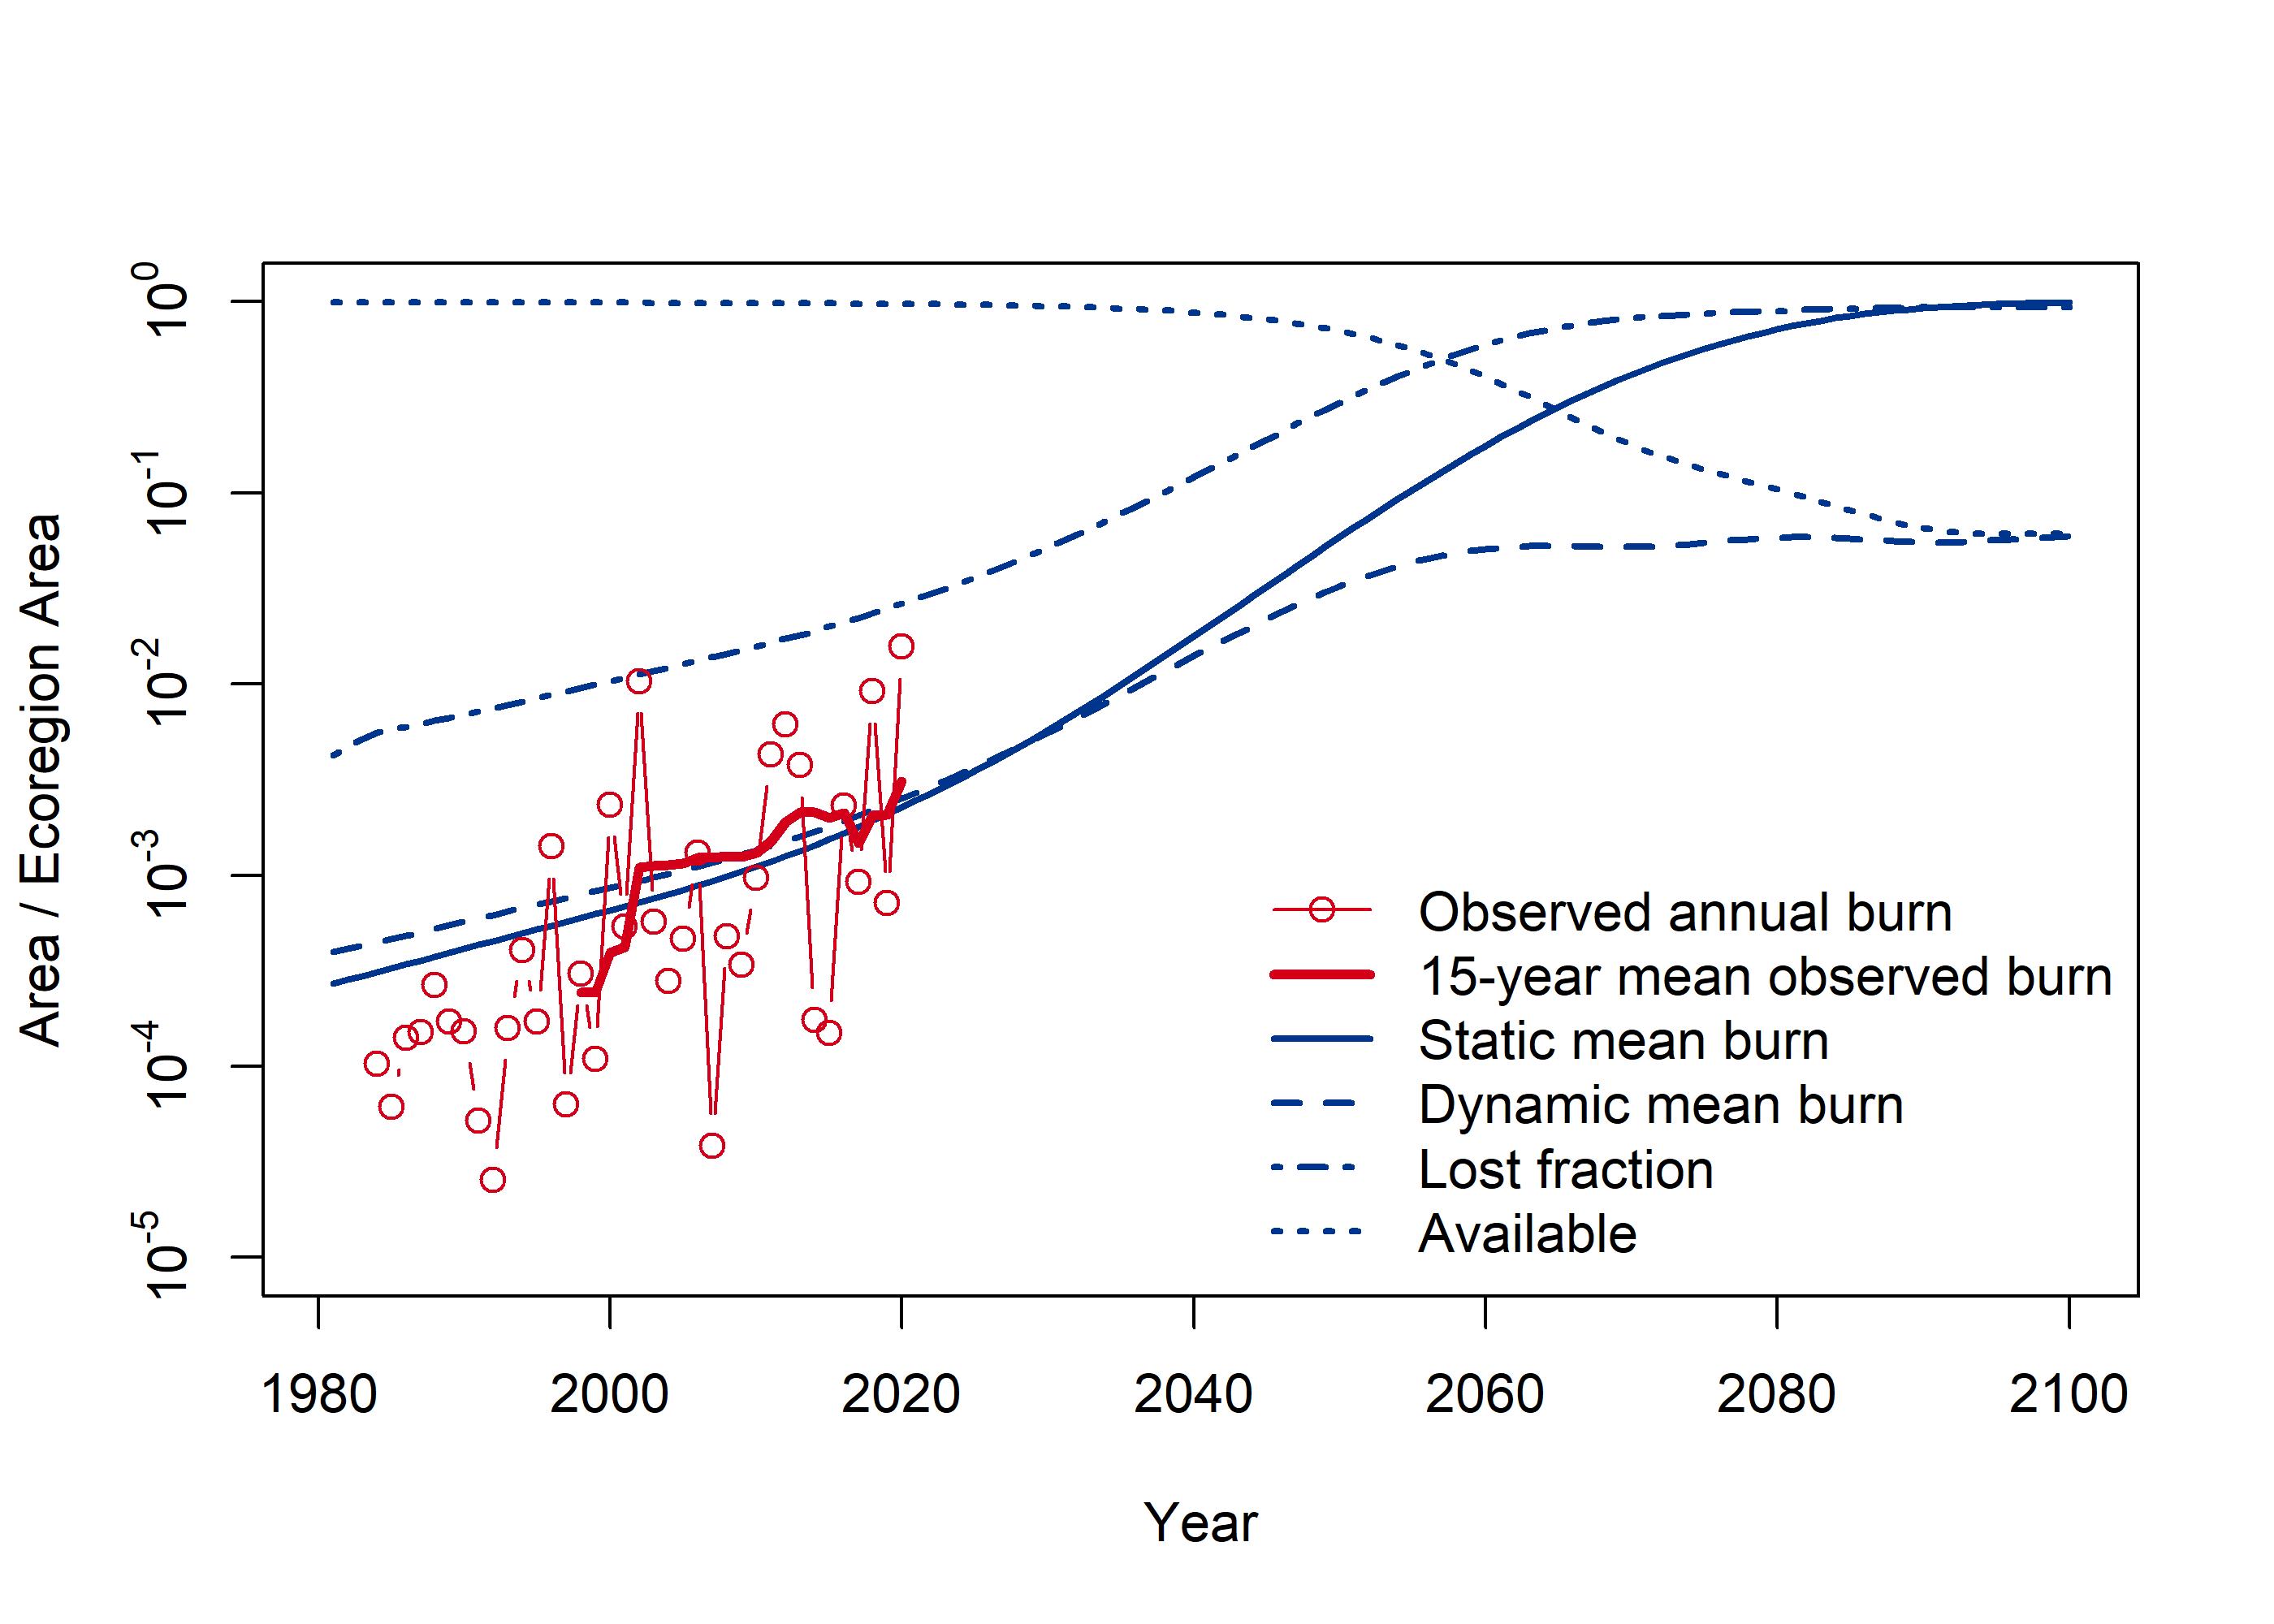
Simulations of average annual burn fraction from static and dynamic models for ecoregion 21 using CanESM5 VPD projections, the lost fraction, ecoregion fraction available to burn, annual observed burn fraction, and 15-year running mean observed burn fraction shows the simulation results for Ecoregion 21 under SSP5-8.5 obtained using CanESM5 climate projections coupled with the dynamic model (the static model results are included for comparison). From 1999 to 2020 the simulation reproduces the running average annual burn fraction since it is trained on those years but during 1984 to 1998 the simulation overestimates because ecoregion 21 experienced annual burned areas during 1999 to 2020 that were on average 3 times as large as those experienced during 1984 to 1998 over a similar VPD range. During 1984 to 1998, this ecoregion experienced 10% lower VPD and 90% lower burned areas than during 1999 and 2020.
Beyond 2020, the static simulation gives the burn fraction increasing until it unrealistically saturates the entire ecoregion area after 2080. In the dynamic simulation, the burn fraction increases initially at the same rate as the static simulation but this rate decreases and the burn fraction tends to more realistic values of 0.04 to 0.06. This demonstrates the benefit of the dynamic model over the static model in creating projections for this ecoregion. The projections in lost fraction and available area show that a steady-state constant burn fraction occurs when the area unavailable to burn (the lost fraction) becomes less than the area available to burn.
The average annual burn fraction from 1950 to 2100 is simulated for the six selected GCMs and the mean of these six projections is used to estimate the relative change in average annual burn fraction by 2030, 2050, 2075 and 2100 relative to 2018. This is performed all 49 ecoregions under each SSP-RCP scenario.

