Projecting future VPD and precipitation
Future projections of VPD and precipitation are derived from the NASA Earth Exchange (NEX) Global Daily Downscaled Projections (GDDP) dataset (NEX-GDDP-CMIP6) available from the NASA Center for Climate Simulation (Thrasher et al., 2022).
This dataset provides climate variables simulated from 35 GCMs over the period 1950 to 2100 for the historical (1950-2014) and CMIP6 Tier 1 scenarios (2015-2100). The daily output has been downscaled to 0.25-degree resolution, and bias-corrected using a daily variant of the monthly bias correction/spatial disaggregation (BCSD) method from the native GCM simulations. High resolution climate simulations are essential for estimating future regional wildfire risk and the daily BCSD method is suitable for wildfire risk assessment (Abatzoglou and Brown, 2012). We use the simulations to derive trends in VPD and precipitation.
Daily VPD was calculated from daily relative humidity, maximum temperature and minimum temperature and Tetens coefficients (Ficklin and Novick, 2017). Climate variables and type of statistical model used in each ecoregion in the catastrophe model domain. VPD denotes vapor pressure deficit and pr denotes precipitation. in the Appendix lists the six GCMs that were selected to create future projections. These six were selected based on how well they were able to reproduce the ecoregion-level seasonal VPD and annual precipitation record between 1979 and 2014. Twenty-four of the 35 GCMs were assessed against the GridMET-derived VPD and precipitation data and for further validation the GCMs were also assessed against CRU-derived data. The year 1979 is the earliest year in the GridMET record and 2014 the latest year in the CRU record. Climate variables and type of statistical model used in each ecoregion in the catastrophe model domain. VPD denotes vapor pressure deficit and pr denotes precipitation. in the Appendix contains the list of 24 GCMs that were assessed.
Ecoregion-level normalized Root Mean Square Error (RMSE) was calculated on seasonal VPD and annual precipitation between each GCM and the standard. For each ecoregion, VPD and/or precipitation were used depending on their presence in the statistical models, for example if the statistical model required both VPD and precipitation, the mean of their separate RMSEs was computed for that ecoregion. The final GCM assessment was based on a GCM-level RMSE which was the weighted average of the ecoregion RMSEs, where the weightings were computed from each ecoregion’s contribution to the Average Annual Loss (AAL) based on the 100,000-year Verisk Wildfire Model for the United States
All GCMs gave a closer match to the CRU standard than GridMET except for TaiESM1. Two possible reasons for this are that CRU data is used to derive the dataset which NEX-GDDP-CMIP6 is bias-corrected by. The second reason is that the resolution of NEX-GDDP-CMIP6 (0.25 deg) is more similar to that of CRU (0.5 deg) than GridMET (~0.04 deg). It is probably a coincidence that the TaiESM1 gives a closer match to GridMET, because the TaiESM1 is found to be a high outlier in temperature and thus VPD.
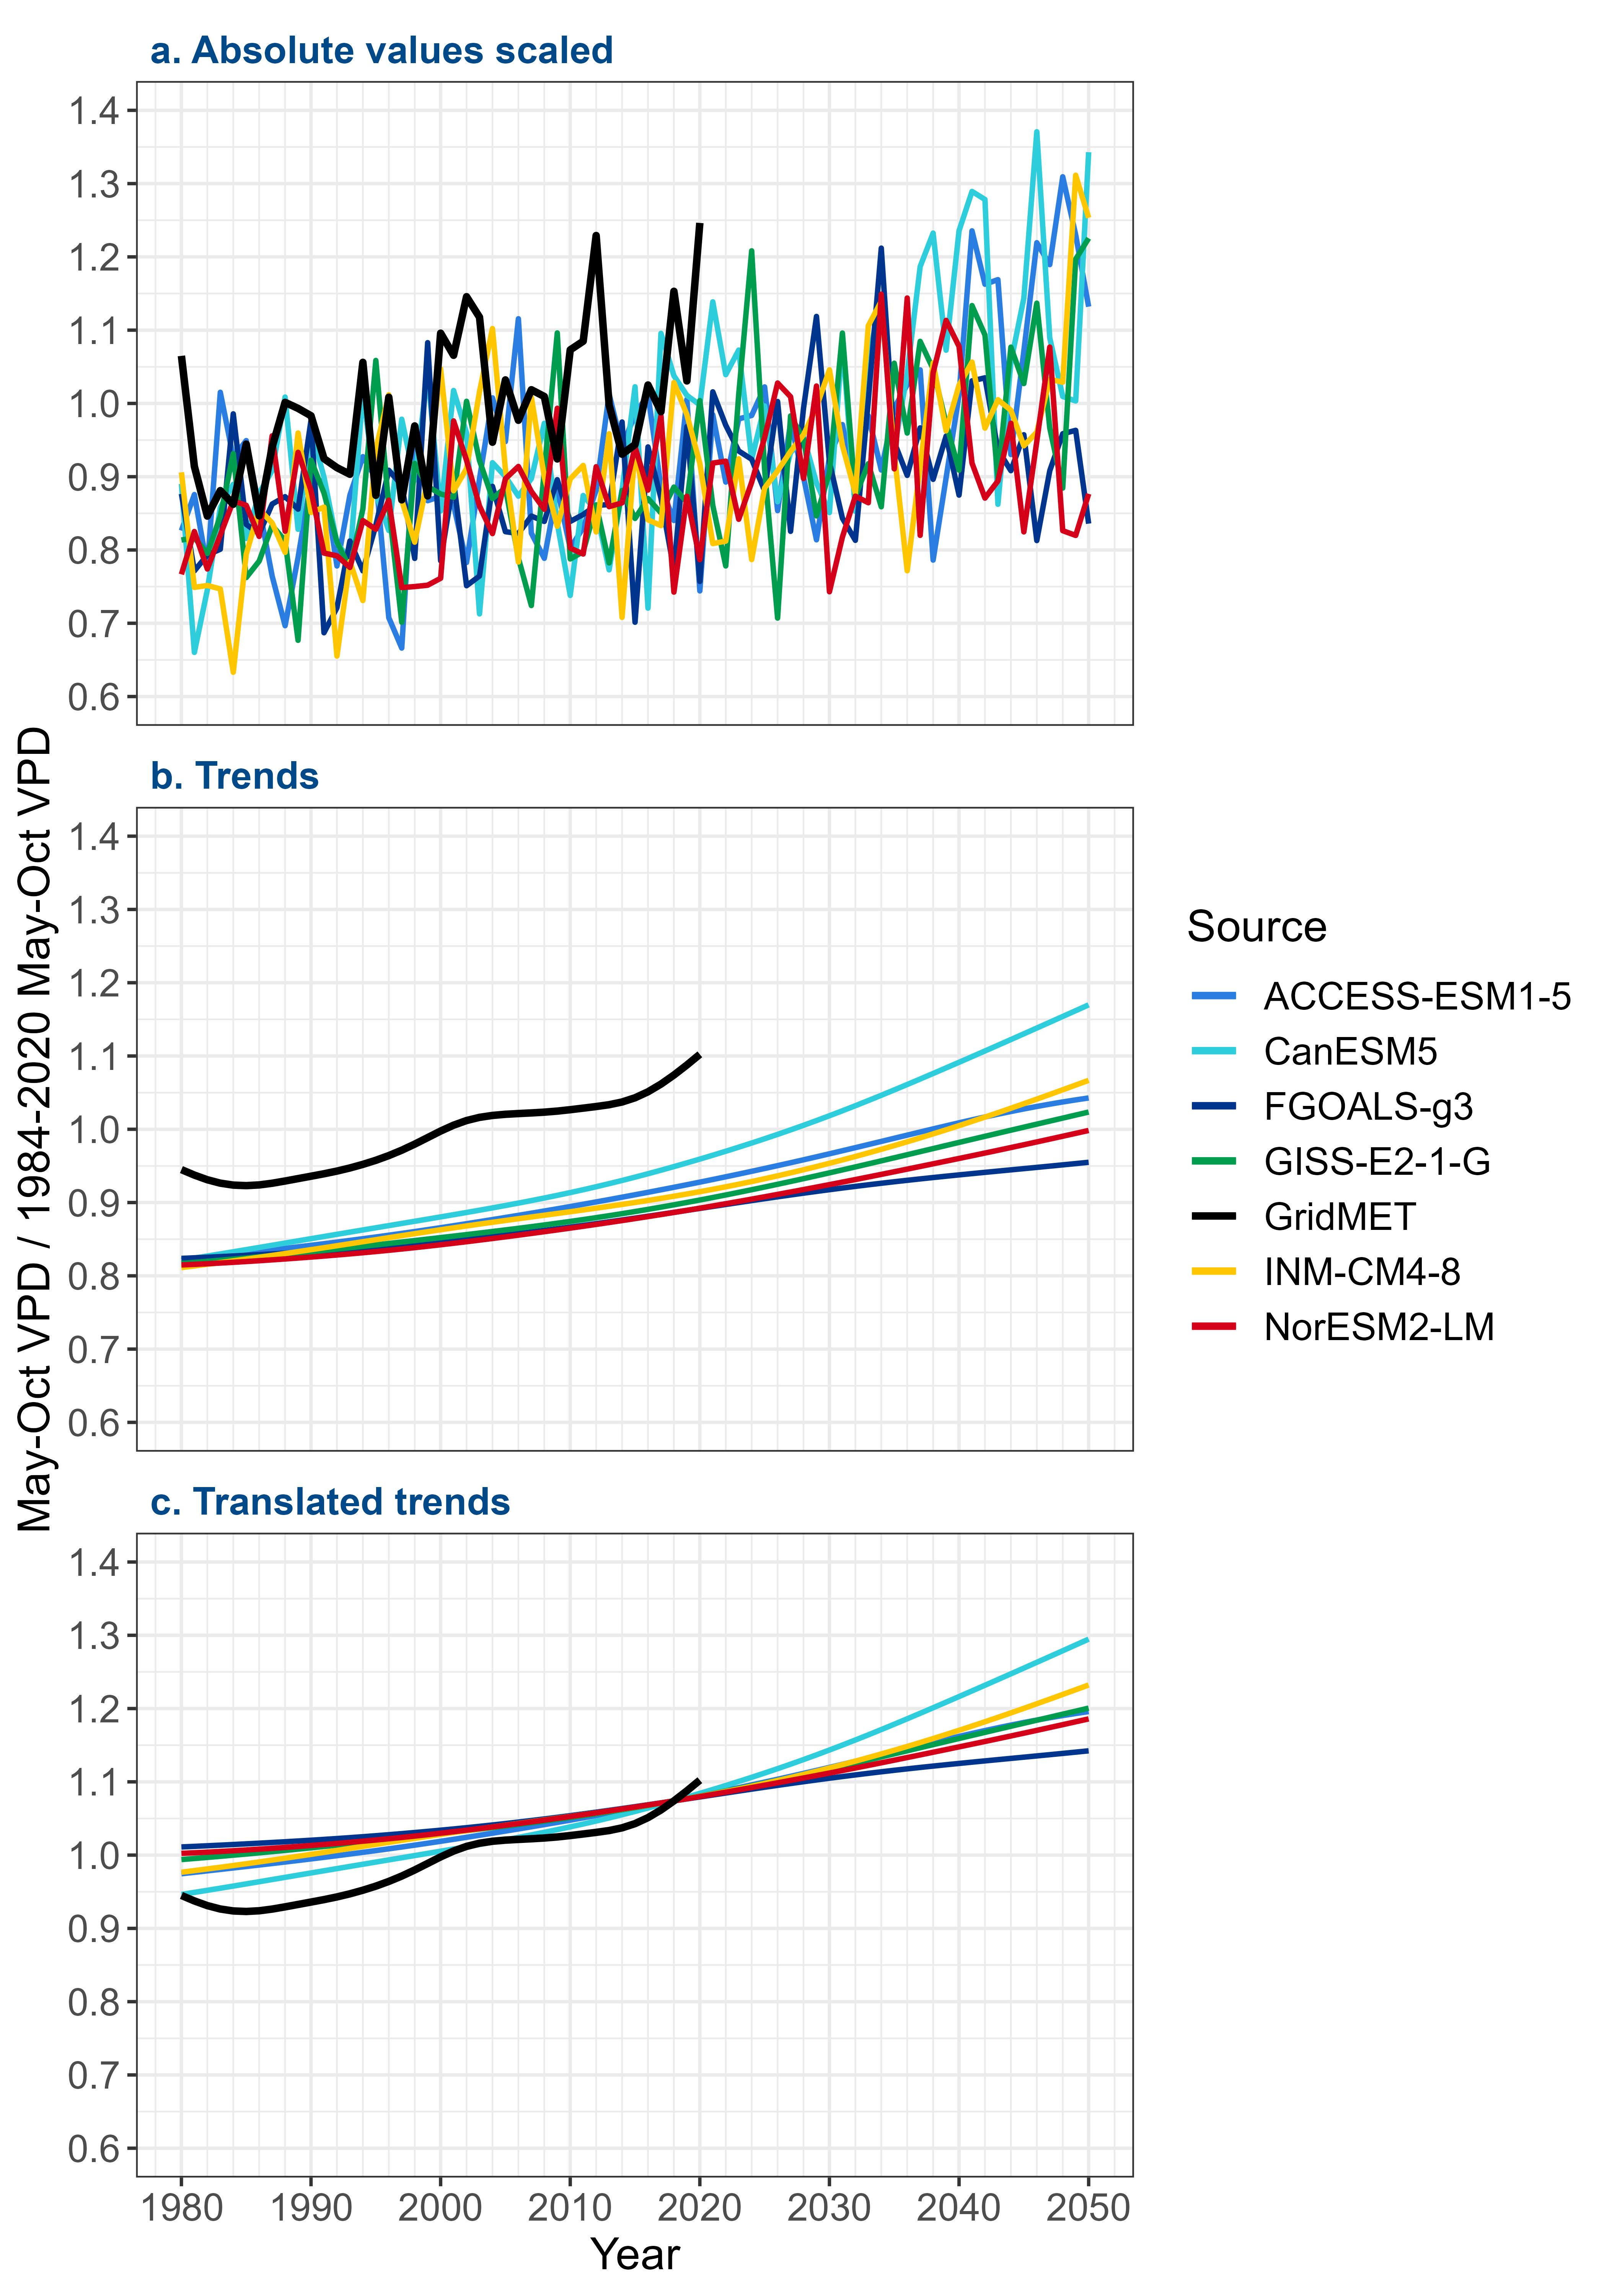
May-Oct mean VPD scaled by the GridMET 1984-2020 May-Oct mean VPD from GCM and GridMET data sources showing absolute values scaled (a), trends derived from cubic spline regression (b), and trends translated to the GridMET 2018 trend value (c) shows an example of the steps taken to derive the VPD and precipitation projections used to compute future fire projections. The example is for VPD in Ecoregion 21 under SSP5-8.5. First, seasonal VPD and annual precipitation timeseries (1950-2100) are derived for each ecoregion under each SSP and scaled using the GridMET mean seasonal VPD (1984-2020) and annual precipitation (1983-2019). May-Oct mean VPD scaled by the GridMET 1984-2020 May-Oct mean VPD from GCM and GridMET data sources showing absolute values scaled (a), trends derived from cubic spline regression (b), and trends translated to the GridMET 2018 trend value (c)a shows a comparison between the six GCMs and GridMET. Trends, shown in May-Oct mean VPD scaled by the GridMET 1984-2020 May-Oct mean VPD from GCM and GridMET data sources showing absolute values scaled (a), trends derived from cubic spline regression (b), and trends translated to the GridMET 2018 trend value (c)b, are found by applying a cubic spline regression with lognormal error distribution using the gamlss R library (Rigby and Stasinopoulos D.M., 2005). The GCM trends are then translated so their 2018 values match the 2018 GridMET value. Results are shown in May-Oct mean VPD scaled by the GridMET 1984-2020 May-Oct mean VPD from GCM and GridMET data sources showing absolute values scaled (a), trends derived from cubic spline regression (b), and trends translated to the GridMET 2018 trend value (c)c. The year 2018 is the vintage of the Verisk Wildfire Model for the United States.

