Search Real-time Wildfire events
View real-time Wildfire footprints and get related metrics in Verisk Catalog Viewer.
You can estimate losses by quantifying the number of exposures that fall within the burn perimeter of the event.
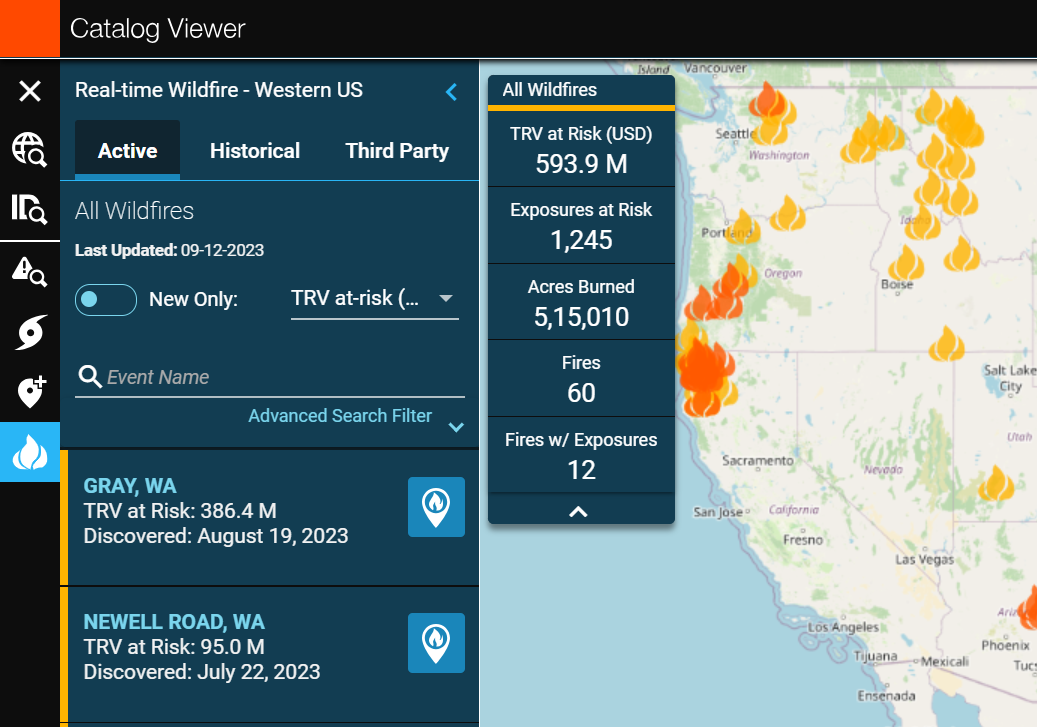
The Wildfire peril user interface displays all the new and active Wildfire events in the Western U.S. region listed in the data panel. It also displays historical Wildfire events from the previous two years. You can also view the locations of these Wildfire events through the Wildfire markers appearing on the map.
- TRV at Risk (USD) - The Total Replacement Value (TRV) represents the value in Verisk's Industry Exposure database impacted by the active and new Wildfire perimeters. The values are indicative of the potential losses from the Wildfire event.
- Exposure at Risk
- Acreage Burned
- New Burn Acres
- Number of Fires
Procedure
-
Click on the wildfire Data - Western U.S..
All real-time Wildfires in the western U.S. region appear on the data panel and the map zooms to the western U.S. region. The location of all the events appears as Wildfire markers on the map.
 The data panel also shows the last server updated time. In case of absence of any real time Wildfire event during the search, there will be display of alert message conveying the absence of realtime events.
-
Alternatively, click New Only to get the list of new
Wildfires which grew over the past twenty four hours.
The date and time stamp indicate when the Wildfire will have burned more than 1000 acres.
Only New events will be displayed on the data panel for your selection.
The locations of the Wildfire events based on the new search criteria get updated on the map.
The aggregated dashboard gets updated based on the new filter selection.
-
From the dropdown button, select one of the below options:
- Select TRV at Risk(high-to-low) to list events based on their decreasing Total Replacement Values.
- Select TRV at Risk(low-to-high) to list events based on their increasing Total Replacement Values.
The default for the display of events in the data grid is TRV at Risk(high-to-low). - Select the event of your choice from the list of events in the data panel to view the event summary and the burn perimeter.
-
Alternatively, you can type the event name in the search text box.
- Click on the Advanced Search events filter.
- Select the date to filter out Wildfire events generated after the selected date.
- Select the U.S. State of your interest from the dropdown list.
- Click Reset all filters to clear all the applied filters.
The Wildfire event of your choice appears on the data panel and on the map. You will receive an error notification indicating the unavailability of data in case of internal server issues.
Results
- Event Name
- TRV at Risk
- Event Discovered date
- Burn Perimeter
- Pop-Up message with key event details
- Downloadable GeoJSON shapefile
- Downloadable PDF report