Dynamic Ring Option
A Dynamic Ring analysis enables you to identify the optimal location for placing a ring of a given size so that you can determine the area of maximum possible accumulation of potential losses within a given set of exposures/data. This option is useful for organizations that want to understand how their exposures are clustered over relatively small distances, especially for terrorism and fire perils where damage can be catastrophic over relatively short distances (less than 1,000 meters). For example, an organization might want to know where a 200-meter ring would be placed such that it would cause the maximum possible loss—this helps the organization avoid writing policies for too many locations in area where they are already exposed beyond their risk appetite. The dynamic ring method recognizes that the center of the ring is not restricted to one of the locations in the exposure data, that the ring can cover more locations if the center is allowed to "roam". For a brief video about the key differences between the traditional, constrained method of grid-based analysis and Touchstone's Dynamic Ring option, click here.
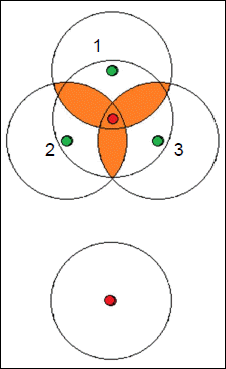
Touchstone determines optimal locations for ring placement by running the latitude and longitude data for all the exposures through an optimization algorithm. The algorithm selects locations that are within the intersecting areas of all rings. For example, in the following illustration, three exposures (marked by the green dots) are within 200 meters of each other—a ring with a radius of 200 m was drawn around each exposure. The algorithm places a point (marked by the red dot) in the center of the area where the 200-meter rings drawn around each exposure intersect (orange shading); it then draws a new dynamic ring, with a 200-meter radius, that includes all three exposures.

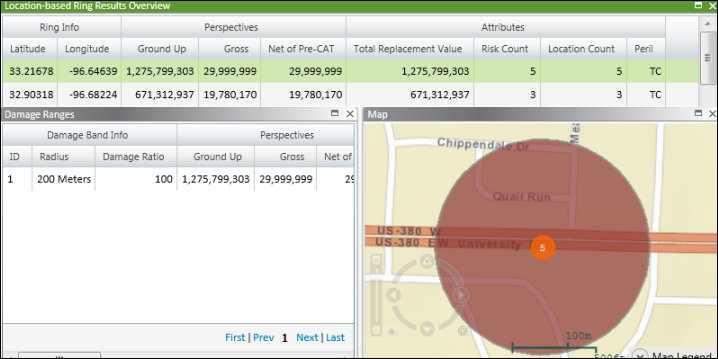
The analysis produces multiple dynamic rings and displays the results in the Location-based Ring Results Overview grid. If you display the map, with the first dynamic ring selected in the grid, the ring with the maximum potential accumulated loss appears. The map displays only one dynamic ring at a time; to view any other dynamic ring, select it in the grid. To sort the results, click a column header. The following image illustrates the initial dynamic ring in an analysis for an exposure view filtered by Texas, where the radius was set to 200 meters and the peril was terrorism; five locations contribute to the loss. The View Options menu in the sidebar enables you to view: damage ranges; contributing contracts, layers, and locations; a map. (The illustration varies depending on your Touchstone version.)

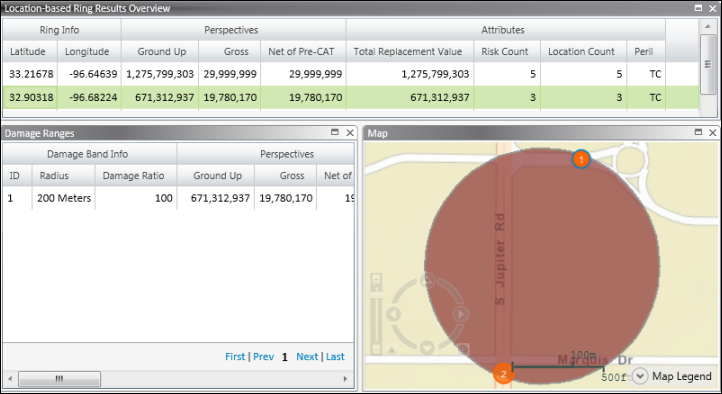
The following image shows the second dynamic ring. The dynamic ring captures the three locations because the 200-meter ring drawn around each exposure has created an intersecting area, the center of which is used to draw the dynamic ring.

Assume that you have a global portfolio containing over 700,000 locations. With a non-dynamic ring analysis, you may get a maximum accumulation in Izmir, Turkey, because the analysis generates the rings using only the exposure locations. However, if you run a Dynamic Ring analysis, you may get a maximum accumulation in London, United Kingdom, because the analysis considers the rings that are centered on locations in between your exposures. The difference in total replacement value (TRV) may be significant (AIR has observed differences of 30% or greater).
How do you choose the size of the ring radius? You consider the worst case scenario of an event happening within a specific radius of the event. For example, in the first image, there are three exposures, "1", "2", and "3", with the highest TRVs, but they are 200 meters from one another. A standard ring analysis based on an event, such as a bomb, occurring at location "1" would not include potential damages to locations "2" and "3" because those locations are outside the ring drawn around location "1". With a Dynamic Ring analysis, you can analyze potential losses to "1", "2", and "3" within a 200-meter radius of the bomb event, which is the center of the ring.
Before running a Dynamic Ring analysis, use filters to create an exposure view that includes all the exposure locations you want to include in the analysis, but where the exposure view does not include locations that are not relevant to the analysis. This approach helps to decrease analysis run time. For example, assume that your Exposure Set includes locations in multiple states, but you want to run a dynamic ring analysis on terrorism exposures in New York City. In this case, create an exposure view with a filter where the city is "NY" and the location peril is "Terrorism".
When you run a Dynamic Ring analysis, you follow the same steps outlined in Overview of Creating a New Geospatial Analysis.
Usage notes
-
A Dynamic Ring analysis is resource-intensive and generates a lot of data. The intensity of calculations and the data that is created depend on the number of locations that participate in the analysis and also on the spatial density of the exposures. While Touchstone does not restrict the number of rings and ring radii, AIR recommends that users do not run very large books with large radii. The maximum number of rings is configurable and currently defaults to 100,000,000.
-
The default radius of the ring is 200.00 meters for a Dynamic Ring analysis on a Property Exposure type of analysis, compared to a default of 500.00 meters for non-Dynamic Ring analyses on Property Exposures. This is because the size of the ring can significantly affect run times; a larger ring takes longer to generate because it may generate more potential ring points. Set the ring size (the radius) based on the density of your exposures.
-
A Dynamic Ring analysis always uses discrete latitude/longitude combinations when placing rings. Therefore, the analysis always removes duplicate rings.
-
You apply a single ring definition to a Dynamic Ring analysis. You cannot add concentric rings.
-
The Location-based Ring Results Overview grid displays the generated latitude and longitude points, TRV, and financial perspectives for each ring. The results are sorted by the highest exposed perspective in descending order. If you do not select any exposed limits, the results are sorted by TRV in descending order.
-
It is possible to have more ring centers than exposures.
-
The Interactive Browser, which is enabled when you select the Enable Dynamic Results option, does not display all the dynamic rings on the map at the same time.
You can export results using the Export option – Geospatial to CSV.
