Draw a layer with locational coordinates
You can draw different shape layers using locational coordinates and subsequently use these layers as spatial filters when you search for events.
The ability to define a layer in this manner is particularly useful for parametric studies.
For more information, see Use cases supported by Catalog Viewer.
On the map, use your cursor to define the shapes.
Procedure
-
Click on the Drawing Tools icon
 .
The Drawing Tools pane appears.
 .
. -
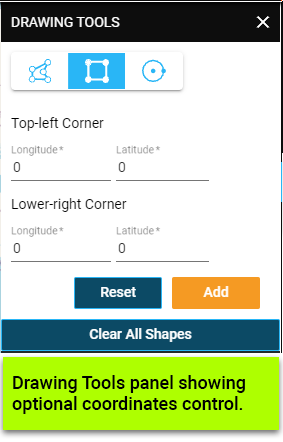
Optionally, click on the Draw Rectangle icon
 .
.
-
Fill in the fields:
- In the Top-left Corner text field, type the longitude and latitude respectively for the upper-left corner of the rectangle.
-
In the Lower-right Corner text field, type the
longitude and latitude respectively for the lower-right corner of the
rectangle.

- Click on the Add button to add the drawn layer to the Map Layers.
- Click on the Reset button to clear the inputs.
-
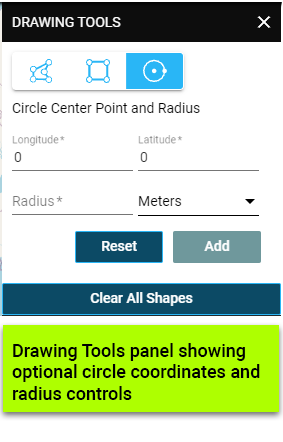
Optionally, click on the Draw Circle icon.
 .
.
-
Fill in the fields:
- In the upper left and right text fields, type the longitude and latitude of the center point of the circle.
- In the lower left text field, type the length of the radius of the circle.
-
In the lower right text field, select the unit of measurement of the
circle from the dropdown list.

- Click on the Add button to add the drawn layer to the Map Layers.
- Click on the Reset button to clear the inputs.
-
Optionally, save the layers you have just drawn.
Results
Your drawn layers appear on the map and get added to the map layers for further filtering the events.

